
Compare JSW Energy with Similar Stocks
Dashboard
Poor Management Efficiency with a low ROCE of 7.13%
- The company has been able to generate a Return on Capital Employed (avg) of 7.13% signifying low profitability per unit of total capital (equity and debt)
Low ability to service debt as the company has a high Debt to EBITDA ratio of 7.65 times
Healthy long term growth as Net Sales has grown by an annual rate of 22.25% and Operating profit at 31.65%
Flat results in Mar 26
With ROCE of 7, it has a Very Expensive valuation with a 1.8 Enterprise value to Capital Employed
Total Returns (Price + Dividend) 
Latest dividend: 2.0098132047860893 per share ex-dividend date: Jun-05-2026
Risk Adjusted Returns v/s
Returns Beta

News
JSW Energy Ltd is Rated Hold by MarketsMOJO
JSW Energy Ltd is rated 'Hold' by MarketsMOJO, with this rating last updated on 11 May 2026. However, the analysis and financial metrics discussed here reflect the company’s current position as of 25 June 2026, providing investors with an up-to-date view of its fundamentals, returns, and market standing.
Read full news article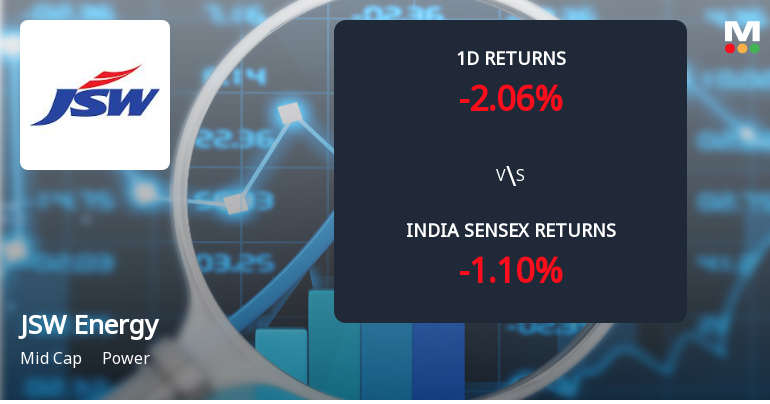
JSW Energy Ltd Sees Significant Open Interest Surge Amid Mixed Market Signals
JSW Energy Ltd (JSWENERGY) has witnessed a notable 10.6% increase in open interest in its derivatives segment, signalling heightened market activity and shifting investor positioning. Despite underperforming its sector and the broader Sensex, the power sector mid-cap’s derivatives market shows signs of evolving directional bets, reflecting a complex interplay of bullish and bearish sentiments.
Read full news article
JSW Energy Ltd Sees Significant Open Interest Surge Amid Mixed Market Signals
JSW Energy Ltd has witnessed a notable 10.3% increase in open interest in its derivatives segment, signalling heightened market activity and shifting investor positioning. Despite a 2.02% decline in the stock price on 23 Jun 2026, the surge in open interest and rising delivery volumes suggest complex directional bets among traders in the power sector.
Read full news article Announcements
Announcement under Regulation 30 (LODR)-Newspaper Publication
20-Jun-2026 | Source : BSEPursuant to Regulation 30 read with Schedule III Part A Para A of the Listing Regulations please find enclosed the copy of the Newspaper advertisement published today in English in Business Standard (all editions) giving notice of the NCLT convened meetings of Equity Shareholders and Unsecured Creditors of the Company scheduled to be held on Monday 20th July 2026 at 10:30 a.m. (IST) and 12:30 p.m. (IST) respectively as per the directions of Honble National Company Law Tribunal Mumbai Bench vide its Order dated 2nd June 2026. The above information is also available on the website of the Company www.jswenergy.in
Announcement under Regulation 30 (LODR)-Newspaper Publication
20-Jun-2026 | Source : BSENotice of the NCLT convened meetings of Equity Shareholders and Unsecured Creditors to approve the proposed scheme of arrangement between GE Power India Limited (Demerged Company) and JSW Energy Limited (Company or Resulting Company) and their respective shareholders under Sections 230 to 232 and other applicable provisions of the Companies Act 2013.
Announcement under Regulation 30 (LODR)-Newspaper Publication
19-Jun-2026 | Source : BSENotice of the NCLT convened meetings of Equity Shareholders and Unsecured Creditors to approve the proposed scheme of arrangement between GE Power India Limited (Demerged Company) and JSW Energy Limited (Company or Resulting Company) and their respective shareholders under Sections 230 to 232 and other applicable provisions of the Companies Act 2013.
Corporate Actions

No Upcoming Board Meetings

JSW Energy Ltd has declared 20% dividend, ex-date: 05 Jun 26

No Splits history available

No Bonus history available

No Rights history available
Quality key factors
Valuation key factors
Technicals key factors
 Technical Indicator Scale: Bearish, Mildly Bearish, Sideways, Mildly Bullish, Bullish Turned
 Shareholding Snapshot : May 2026
Shareholding Compare (%holding)
Promoters
13.6854
Held by 30 Schemes (7.34%)
Held by 380 FIIs (11.31%)
Jsw Investments Private Limited (16.99%)
Lici Ulip-growth Fund (6.93%)
3.59%
Quarterly Results Snapshot (Consolidated) - Mar'26 - QoQ

QoQ Growth in quarter ended Mar 2026 is 10.21% vs -21.16% in Dec 2025
QoQ Growth in quarter ended Mar 2026 is -11.52% vs -40.41% in Dec 2025
Half Yearly Results Snapshot (Consolidated) - Sep'25
Growth in half year ended Sep 2025 is 68.72% vs -1.13% in Sep 2024

Growth in half year ended Sep 2025 is 5.29% vs 20.61% in Sep 2024
Nine Monthly Results Snapshot (Consolidated) - Dec'25
YoY Growth in nine months ended Dec 2025 is 68.33% vs -1.99% in Dec 2024
YoY Growth in nine months ended Dec 2025 is 21.06% vs 12.50% in Dec 2024
Annual Results Snapshot (Consolidated) - Mar'26
YoY Growth in year ended Mar 2026 is 60.92% vs 2.26% in Mar 2025
YoY Growth in year ended Mar 2026 is 14.78% vs 13.25% in Mar 2025
About JSW Energy Ltd

Company Coordinates


