K.P. Energy

INR
242.95
-9.15 (-3.63%)
BSENSE

Aug 17, 01:11 PM

BSE+NSE Vol: 6.39 lacs

  • Price Points
  • Score
  • Mojo Parameters
  • Total Return
  • News and Corporate Actions
  • Key factors
  • Shareholding
  • Financials
  • CompanyCV
stock-summaryPrice Point
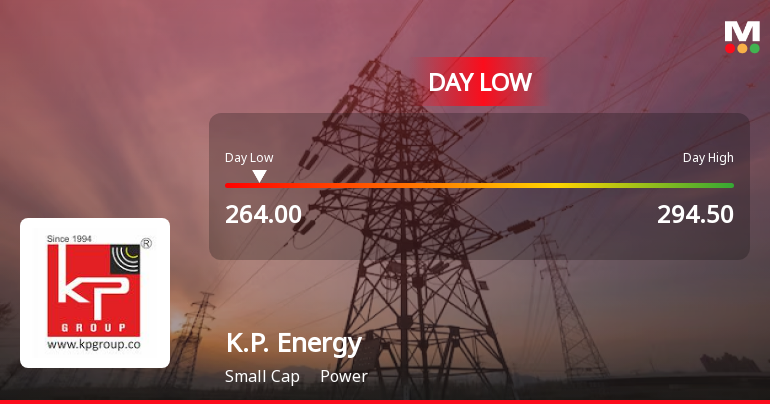
High/Low

1Day

52 Week

Valuation
Technical
Day's Volume

CASH

6.39 lacs (34.68%) Volume

Shareholding (Jun 2026)

FII

0.52%

Held by 22 FIIs

DII

1.03%

Held by 0 DIIs

Promoter

45.31%

Why is K.P. Energy Ltd falling/rising?

17-Aug-2026

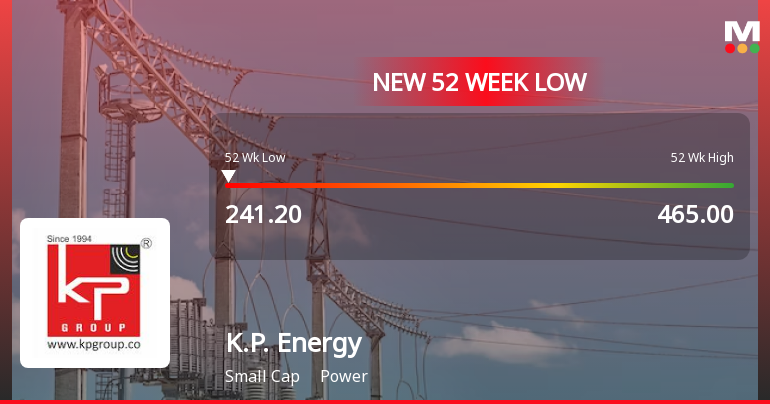
As of 16-Aug, K.P. Energy Ltd's stock price is Rs 254.00, down 0.88% and has declined 21.41% over the past eight days. The stock is significantly underperforming with a year-to-date drop of 28.42% and is close to its 52-week low, reflecting weak investor interest and a lack of confidence in its valuation despite strong fundamentals.

As of 16-Aug, K.P. Energy Ltd's stock price is falling, currently at Rs 254.00, reflecting a decrease of Rs 2.25 or 0.88%. The stock has been on a downward trend, having lost value for the past eight consecutive days, resulting in a total decline of 21.41% during this period. Additionally, the stock is trading lower than its 5-day, 20-day, 50-day, 100-day, and 200-day moving averages, indicating a persistent bearish sentiment.<BR><BR>The stock's performance over various time frames further illustrates its struggles, with a year-to-date decline of 28.42% and a staggering 39.63% drop over the past year, significantly underperforming the broader market, which has seen a return of 3.82% in the same period. Furthermore, K.P. Energy Ltd is currently close to its 52-week low, being just 4.72% away from Rs 242.<BR><BR>Investor participation has also waned, as evidenced by a 19.06% decrease in delivery volume compared to the 5-day average. This lack of interest from investors, combined with the stock's underperformance relative to the sector, has contributed to its falling price. Despite the company's strong fundamentals, including healthy growth in net sales and operating profit, the absence of domestic mutual fund investment—holding 0% of the company—suggests a lack of confidence in its current valuation, further exacerbating the stock's decline.

View full answer

Who are in the management team of K.P. Energy?

14-Aug-2026

The management team of K.P. Energy includes key members such as Farukbhai Patel (Managing Director), Ashish A Mithani (Whole-time Director), and Bhadrabala Joshi (Chairperson), along with several other directors and independent directors who guide the company's strategic direction and operations.

The management team of K.P. Energy includes the following key members:<BR><BR>1. **Farukbhai Patel** - Managing Director<BR>2. **Ashish A Mithani** - Whole-time Director<BR>3. **Ashish A Mithani** - Non-Executive Director<BR>4. **Bhadrabala Joshi** - Chairperson<BR>5. **Sajesh Kolte** - Independent Director<BR>6. **Bhupendra Vadilal Shah** - Director<BR>7. **Karmit H Sheth** - Company Secretary<BR>8. **Salim Yahoo** - Additional Independent Director<BR>9. **Affan Patel** - Whole-time Director<BR>10. **Vendhan G Mudaliar** - Additional Independent Director<BR>11. **Arvindkumar Tribhovandas Patadia** - Additional Director<BR>12. **Neethimani Karunamoorthy** - Additional Director<BR>13. **Venu Birappa** - Additional Director and Independent Director<BR>14. **DUKHABANDHU RATH** - Additional Director<BR>15. **Amitkumar Subhashchandra Khandelwal** - Whole-time Director & Additional Director<BR><BR>This team plays a crucial role in guiding the company's strategic direction and operations.

View full answer

What does K.P. Energy do?

14-Aug-2026

K.P. Energy Ltd provides Balance of Plant solutions for the wind energy sector and reported net sales of 519 Cr and a net profit of 26 Cr for June 2026, with a market cap of INR 1,765 Cr. The company has a P/E ratio of 10.00 and a return on equity of 34.66%.

Overview:<BR>K.P. Energy Ltd is a leading provider of Balance of Plant (BoP) solutions for the wind energy industry, operating in the small-cap power sector.<BR><BR>History:<BR>K.P. Energy Ltd was originally incorporated as a private limited company in 2010 and converted into a public limited company in 2015. The latest quarterly results reported net sales and profit for June 2026.<BR><BR>Financial Snapshot:<BR>Net Sales: 519 Cr (Quarterly Results - Jun 2026) <BR>Net Profit: 26 Cr (Quarterly Results - Jun 2026) <BR>Market Cap: INR 1,765 Cr (Small Cap)<BR><BR>Key Metrics:<BR>P/E: 10.00 <BR>Industry P/E: 36 <BR>Dividend Yield: 0.21% <BR>Debt-Equity: 0.70 <BR>Return on Equity: 34.66% <BR>Price to Book: 3.37 <BR><BR>Contact Details:<BR>Address: A-1/2 Firdos Tower, Adajan Patia Surat Gujarat : 395009 <BR>Tel: 91-261-2764757 <BR>Email: info@kpenergy.in <BR>Website: http://www.kpenergy.in

View full answer

Who are the peers of the K.P. Energy?

14-Aug-2026

K.P. Energy's peers include Ujaas Energy, Reliance Infra, Guj Inds. Power, and others, with varying management and growth risks. K.P. Energy has a 1-year return of -40.87%, better than Reliance Infra's -73.52% but worse than Guj Inds. Power's -6.66%.

Peers: The peers of K.P. Energy are Ujaas Energy, Reliance Infra., Guj Inds. Power, Insolation Ener, Orient Green, Kotyark Indust., Vilas Transcore, India Power Corp, and Sustainable Ener.<BR><BR>Quality Snapshot: Excellent management risk is observed at Kotyark Indust., while Average management risk is found at Ujaas Energy, Insolation Ener, Vilas Transcore, India Power Corp, and Sustainable Ener. Below Average management risk is present at Reliance Infra., Guj Inds. Power, Orient Green, and the rest. For growth, Excellent growth is noted at Insolation Ener and Kotyark Indust., while K.P. Energy also shows Excellent growth. Below Average growth is seen at Ujaas Energy, Reliance Infra., Guj Inds. Power, Orient Green, India Power Corp, and Sustainable Ener, and the rest. Good capital structure is exhibited by Guj Inds. Power, Insolation Ener, K.P. Energy, and Kotyark Indust., while Below Average capital structure is found at Ujaas Energy, Reliance Infra., Orient Green, India Power Corp, and Sustainable Ener, and the rest.<BR><BR>Return Snapshot: The peer with the highest 1-year return is Guj Inds. Power at -6.66%, while the peer with the lowest 1-year return is Reliance Infra. at -73.52%. K.P. Energy's 1-year return of -40.87% is better than Reliance Infra. but worse than Guj Inds. Power. Additionally, the six-month return is negative for Reliance Infra., Insolation Ener, and K.P. Energy.

View full answer

How big is K.P. Energy?

14-Aug-2026

As of 14th August, K.P. Energy Ltd has a market capitalization of 1,708.51 Cr, with recent Net Sales of 1,797.01 Cr and a Net Profit of 182.06 Cr. The company reported Shareholder's Funds of 313.16 Cr and Total Assets of 1,168.52 Cr for the latest annual period ending in March 2025.

As of 14th August, K.P. Energy Ltd has a market capitalization of 1,708.51 Cr, categorizing it as a Small Cap company.<BR><BR>In the latest 4 quarters, K.P. Energy reported Net Sales of 1,797.01 Cr and a Net Profit of 182.06 Cr.<BR><BR>For the latest annual period ending in March 2025, the company had Shareholder's Funds of 313.16 Cr and Total Assets amounting to 1,168.52 Cr.

View full answer

Should I buy, sell or hold K.P. Energy Ltd?

13-Aug-2026

When is the next results date for K.P. Energy Ltd?

06-Aug-2026

The next results date for K.P. Energy Ltd is 11 August 2026.

The next results date for K.P. Energy Ltd is scheduled for 11 August 2026.

View full answer

Are K.P. Energy Ltd latest results good or bad?

08-May-2026

K.P. Energy Ltd's latest Q4 FY26 results are strong, with a net profit of ₹78.69 crores (up 71.85% year-on-year) and record revenue of ₹631.81 crores (up 57.48%). However, rising interest costs could pose future challenges despite the company's solid performance in the renewable energy sector.

K.P. Energy Ltd's latest results for Q4 FY26 can be considered quite good overall. The company reported a net profit of ₹78.69 crores, which represents a significant year-on-year growth of 71.85%. Additionally, revenue reached an all-time high of ₹631.81 crores, marking a 57.48% increase compared to the same quarter last year. This impressive performance is further highlighted by an 83.15% sequential growth from the previous quarter.<BR><BR>The operating margin for the quarter stood at 20.72%, which, while showing a slight compression from the previous quarter, is still a notable improvement from the same period last year. The return on equity (ROE) is also strong at 35.39%, indicating effective capital utilization.<BR><BR>However, it's important to note that the company has experienced a sharp increase in interest costs, which rose by 89.17% year-on-year. This increase in financial burden could be a concern moving forward, especially as the company continues to expand.<BR><BR>In summary, K.P. Energy's latest results reflect strong revenue and profit growth, showcasing its robust position in the renewable energy sector, despite some rising leverage concerns.

View full answer

Has K.P. Energy Ltd declared dividend?

23-Jan-2026

K.P. Energy Ltd has declared a 4% dividend, with an ex-date of January 28, 2026. While recent returns have been negative, the company has shown significant long-term growth, particularly with a 5-year total return of 2591.71%.

K.P. Energy Ltd has declared a 4% dividend.<BR><BR>Dividend Details:<BR>- Percentage announced: 4%<BR>- Ex-date: 28 Jan 26<BR><BR>Dividend Yield: 0.25%.<BR><BR>Total Returns by Period:<BR>In the last 3 months, K.P. Energy Ltd experienced a price return of -30.73%, a dividend return of 0.11%, resulting in a total return of -30.62%.<BR><BR>Over the past 6 months, the company saw a price return of -44.92%, a dividend return of 0.15%, leading to a total return of -44.77%.<BR><BR>In the last year, the price return was -31.28%, with a dividend return of 0.28%, culminating in a total return of -31.0%.<BR><BR>For the 2-year period, K.P. Energy Ltd recorded a price return of -11.05%, a dividend return of 0.35%, resulting in a total return of -10.7%.<BR><BR>In the 3-year span, the company achieved a remarkable price return of 370.61%, with a dividend return of 2.59%, leading to a total return of 373.2%.<BR><BR>Over the last 4 years, K.P. Energy Ltd experienced a price return of 404.46%, a dividend return of 5.32%, resulting in a total return of 409.78%.<BR><BR>In the 5-year period, the company saw an extraordinary price return of 2563.02%, with a dividend return of 28.69%, culminating in a total return of 2591.71%.<BR><BR>Overall, K.P. Energy Ltd has declared a dividend, and while recent returns have been negative over shorter periods, the long-term performance shows significant growth, particularly in price returns over the last several years.

View full answer

Is K.P. Energy overvalued or undervalued?

11-Nov-2025

As of November 10, 2025, K.P. Energy is considered undervalued with a favorable valuation grade shift, featuring a PE Ratio of 20.70 and an EV to EBITDA of 15.25, especially when compared to peers like Rail Vikas and Ircon International, despite a year-to-date stock decline of 23.33% against the Sensex's gain of 6.91%, while showing strong long-term growth potential with a 558.57% return over the past three years.

As of 10 November 2025, K.P. Energy's valuation grade has moved from expensive to very attractive, indicating a significant shift in its perceived value. The company is currently considered undervalued. Key ratios include a PE Ratio of 20.70, an EV to EBITDA of 15.25, and a PEG Ratio of 0.29, all of which suggest a favorable valuation compared to its peers.<BR><BR>In comparison with notable peers, Rail Vikas has a PE Ratio of 55.27 and an EV to EBITDA of 67.62, while Ircon International shows a PE Ratio of 22.94 and an EV to EBITDA of 18.17. These comparisons highlight K.P. Energy's relative attractiveness in the market. Despite recent stock performance lagging behind the Sensex, particularly with a year-to-date decline of 23.33% compared to the Sensex's gain of 6.91%, the long-term growth potential remains strong, as evidenced by a remarkable 558.57% return over the past three years.

View full answer

Is K.P. Energy technically bullish or bearish?

11-Nov-2025

As of November 10, 2025, K.P. Energy's technical trend has shifted to a moderately strong bearish stance, supported by bearish indicators from MACD, moving averages, and Bollinger Bands, despite some mildly bullish signals from Dow Theory and OBV.

As of 10 November 2025, the technical trend for K.P. Energy has changed from mildly bearish to bearish. The current technical stance is bearish with a moderate strength. Key indicators driving this stance include the weekly MACD showing bearish momentum, the daily moving averages confirming a bearish trend, and the Bollinger Bands indicating bearish conditions on both weekly and monthly time frames. Additionally, the KST is bearish on a weekly basis, further supporting the bearish outlook. Despite some mildly bullish signals from Dow Theory and OBV on the monthly time frame, the overall technical picture remains negative.

View full answer

How has been the historical performance of K.P. Energy?

09-Nov-2025

K.P. Energy has demonstrated significant growth from March 2021 to March 2025, with net sales increasing from INR 71.74 crore to INR 938.77 crore, and profit after tax rising from INR 6.06 crore to INR 116.05 crore. The company's total assets and cash flow from operating activities have also improved markedly during this period.

Answer:<BR>The historical performance of K.P. Energy shows significant growth in net sales and profitability over the years, particularly from March 2021 to March 2025.<BR><BR>Breakdown:<BR>K.P. Energy's net sales have increased dramatically from INR 71.74 crore in March 2021 to INR 938.77 crore in March 2025, indicating a robust growth trajectory. The total operating income has followed a similar trend, rising from INR 71.74 crore in March 2021 to INR 938.77 crore in March 2025. The company's operating profit (PBDIT) has also seen substantial growth, climbing from INR 17.84 crore in March 2021 to INR 196.08 crore in March 2025, with an operating profit margin of 18.79% in the latest fiscal year. Profit before tax has surged from INR 9.50 crore in March 2021 to INR 154.71 crore in March 2025, while profit after tax has increased from INR 6.06 crore to INR 116.05 crore over the same period. The total assets of K.P. Energy have expanded from INR 259.93 crore in March 2020 to INR 1,168.52 crore in March 2025, reflecting a significant increase in both current and non-current assets. Total liabilities have also risen, from INR 259.93 crore to INR 1,168.52 crore, with long-term borrowings increasing from INR 26.39 crore to INR 185.25 crore. The cash flow from operating activities has improved markedly, reaching INR 161 crore in March 2025, while the closing cash and cash equivalents have increased from INR 7 crore in March 2020 to INR 45 crore in March 2025, showcasing the company's enhanced liquidity position.

View full answer

Who are the top shareholders of the K.P. Energy?

17-Jul-2025

The top shareholder of K.P. Energy is Farukbhai Gulambhai Patel, holding 44.81%. Other significant shareholders include Veer Value Ventures LLP at 2.24% and individual investors with a combined 41.67%.

The top shareholders of K.P. Energy include Farukbhai Gulambhai Patel, who holds the highest stake at 44.81%. Other notable shareholders are Veer Value Ventures LLP, with a holding of 2.24%, and individual investors collectively owning 41.67%. Additionally, there are 9 foreign institutional investors (FIIs) holding 0.8% and one mutual fund scheme with a 0.04% stake. There are no pledged promoter holdings reported.

View full answer

What is the bonus history of the K.P. Energy?

06-Jun-2025

K.P. Energy has issued bonuses to shareholders multiple times, with the most recent being a 2:1 bonus announced for February 12, 2024. Previous bonuses include a 3:3 issue on April 26, 2018, and a 3:2 issue on March 15, 2017.

K.P. Energy has a history of issuing bonuses to its shareholders. The most recent bonus announcement is a 2:1 bonus issue, which has an ex-date of February 12, 2024. Prior to this, the company issued bonuses on two occasions: <BR><BR>1. On April 26, 2018, K.P. Energy had a bonus issue with a ratio of 3:3, with the record date being May 1, 2018.<BR>2. Earlier, on March 15, 2017, there was a bonus issue with a ratio of 3:2, and the record date for this was March 16, 2017.<BR><BR>This information reflects the company's approach to rewarding its shareholders through bonus issues over the years.

View full answer
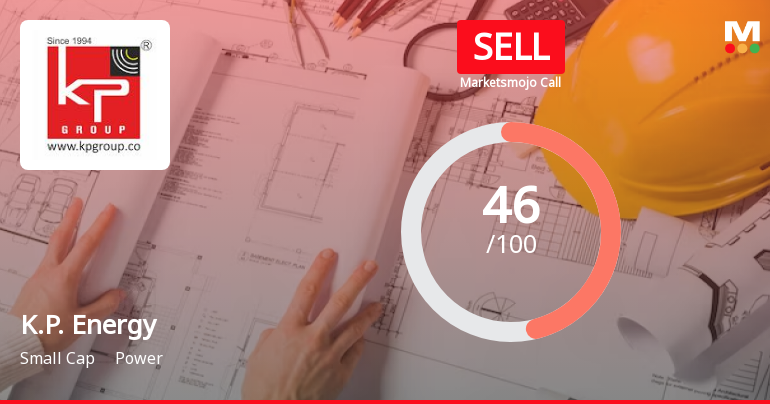
iScoreScore
Click here to find our call on this stock
Strong Sell
Sell
Hold
Buy
Strong Buy

Dashboard

1

Despite the size of the company, domestic mutual funds hold only 0% of the company

  • Domestic mutual funds have capability to do in-depth on-the-ground research on companies- their small stake may signify either they are not comfortable at the price or the business
2

Underperformed the market in the last 1 year

stock-summaryMojo Parameters

Mojo Parameters

Loading Valuation Snapshot...

Stock DNA

stock-summary
Industry

Power

stock-summary
Market cap

INR 1,647 Cr (Small Cap)

stock-summary
P/E

9.00

stock-summary
Industry P/E

35

stock-summary
Dividend Yield

0.21%

stock-summary
Debt Equity

0.70

stock-summary
Return on Equity

34.66%

stock-summary
Price to Book

3.29

Revenue and Profits:
Net Sales:
519 Cr
(Quarterly Results - Jun 2026)
Net Profit:
26 Cr
stock-summaryTotal Returns
Total Returns (Price + Dividend) stock-summary
Dividend Yield (0.21%)
TimePeriod
Price Return
Dividend Return
Total Return
3 Months
-30.44%
0%
-30.44%
6 Months
-19.51%
0%
-19.51%
1 Year
-42.26%
0.13%
-42.13%
2 Years
-35.0%
0.31%
-34.69%
3 Years
94.62%
0.78%
95.4%
4 Years
391.6%
2.05%
393.65%
5 Years
1654.15%
10.06%
1664.21%

Latest dividend: 0.2 per share ex-dividend date: Jan-28-2026

Risk Adjusted Returns v/s stock-summary
Returns Beta
Icon
Beta has not been calculated since enough price history is not available
stock-summaryNews & Corporate Actions

Announcements stock-summary

Announcement under Regulation 30 (LODR)-Analyst / Investor Meet - Outcome

12-Aug-2026 | Source : BSE

K.P. Energy Limited submitted exchange the Audio Recording of Analyst/Investor Earnings Conference Call held on August 12 2026 at 03:00 PM to discuss the unaudited financial results for the quarter ended June 30 2026.

Announcement under Regulation 30 (LODR)-Newspaper Publication

12-Aug-2026 | Source : BSE

K.P. Energy Limited submitted Exchange the copies of newspaper publication of unaudited financial results for the quarter ended June 30 2026 published in The Indian Express (English) and Financial Express (Gujarati) both dated August 12 2026

Board Meeting Outcome for Approval Of Unaudited Standalone And Consolidated Financial Results For The Quarter Ended June 30 2026

11-Aug-2026 | Source : BSE

K.P. Energy Limited has informed the exchange regarding the outcome of Board Meeting held on August 11 2026 and submitted Unaudited Standalone and Consolidated Financial results for the Quarter Ended June 30 2026. The detail outcome is enclosed.

Corporate Actions stock-summary

stock-summary
BOARD MEETING

No Upcoming Board Meetings

stock-summary
DIVIDEND

K.P. Energy Ltd has declared 4% dividend, ex-date: 28 Jan 26

stock-summary
SPLITS

K.P. Energy Ltd has announced 5:10 stock split, ex-date: 10 Mar 23

stock-summary
BONUS

K.P. Energy Ltd has announced 2:1 bonus issue, ex-date: 12 Feb 24

stock-summary
RIGHTS

No Rights history available

stock-summaryKey Factors

Quality key factors stock-summary

Factor
Value
Sales Growth (5y)
84.19%
EBIT Growth (5y)
83.60%
EBIT to Interest (avg)
7.25
Debt to EBITDA (avg)
1.06
Net Debt to Equity (avg)
0.70
Sales to Capital Employed (avg)
2.10
Tax Ratio
29.06%
Dividend Payout Ratio
3.47%
Pledged Shares
0
Institutional Holding
1.56%
ROCE (avg)
34.67%
ROE (avg)
31.52%

Valuation key factors

Factor
Value
P/E Ratio
9
Industry P/E
35
Price to Book Value
3.29
EV to EBIT
6.96
EV to EBITDA
6.29
EV to Capital Employed
2.35
EV to Sales
1.16
PEG Ratio
0.20
Dividend Yield
0.21%
ROCE (Latest)
32.81%
ROE (Latest)
34.66%

Technicals key factors

Indicator
Weekly
Monthly
MACD
Bearish
Bearish
RSI
Bullish
No Signal
Bollinger Bands
Bearish
Bearish
Moving Averages
Bearish (Daily)
KST
Bearish
Mildly Bearish
Dow Theory
Mildly Bearish
Mildly Bearish
OBV
Mildly Bearish
Mildly Bearish
stock-summary Technical Indicator Scale: Bearish, Mildly Bearish, Sideways, Mildly Bullish, Bullish  Turned 
stock-summaryShareholding
Shareholding Snapshot : Jun 2026stock-summary
Shareholding Compare (%holding) stock-summary
Majority shareholders

Non Institution

Pledged Promoter Holdings

None

Mutual Funds

Held by 0 Schemes

FIIs

Held by 22 FIIs (0.52%)

Promoter with highest holding

Farukbhai Gulambhai Patel (45.1%)

Highest Public shareholder

Manish Kantilal Haria (1.92%)

Individual Investors Holdings

43.29%

stock-summaryFinancial
[
  {
    "link": "quarterly",
    "btn_text": "All Quarterly Results",
    "header": "Quarterly Results Snapshot (Consolidated) - Jun'26 - YoY",
    "rhs": [
      {
        "prefix": "Net Sales ",
        "suffix": "YoY Growth in quarter ended Jun 2026 is 136.61% vs 72.62% in Jun 2025",
        "dir": 1
      },
      {
        "prefix": "Consolidated Net Profit ",
        "suffix": "YoY Growth in quarter ended Jun 2026 is 2.60% vs 39.59% in Jun 2025",
        "dir": -1
      }
    ],
    "table": {
      "header": [
        "Jun'26",
        "Jun'25",
        "Change(%)"
      ],
      "body": [
        {
          "field": "Net Sales",
          "val1": "519.46",
          "val2": "219.54",
          "chgp": "136.61%",
          "chgp_class": "positive"
        },
        {
          "field": "Operating Profit (PBDIT) excl Other Income",
          "val1": "60.54",
          "val2": "48.57",
          "chgp": "24.64%",
          "chgp_class": "positive"
        },
        {
          "field": "Interest",
          "val1": "15.43",
          "val2": "9.35",
          "chgp": "65.03%",
          "chgp_class": "negative"
        },
        {
          "field": "Exceptional Items",
          "val1": "0.00",
          "val2": "0.00",
          "chgp": "",
          "chgp_class": "neutral"
        },
        {
          "field": "Consolidate Net Profit",
          "val1": "26.08",
          "val2": "25.42",
          "chgp": "2.60%",
          "chgp_class": "positive"
        },
        {
          "field": "Operating Profit Margin (Excl OI)",
          "val1": "11.65%",
          "val2": "22.12%",
          "chgp": "-10.47%",
          "chgp_class": "negative"
        }
      ]
    }
  },
  {
    "link": "half-yearly",
    "btn_text": "All Half Yearly Results",
    "header": "Half Yearly Results Snapshot (Consolidated) - Sep'25",
    "rhs": [
      {
        "prefix": "Net Sales ",
        "suffix": " Growth in half year ended Sep 2025 is 59.66% vs 77.82% in Sep 2024",
        "dir": -1
      },
      {
        "prefix": "Consolidated Net Profit ",
        "suffix": " Growth in half year ended Sep 2025 is 42.22% vs 84.24% in Sep 2024",
        "dir": -1
      }
    ],
    "table": {
      "header": [
        "Sep'25",
        "Sep'24",
        "Change(%)"
      ],
      "body": [
        {
          "field": "Net Sales",
          "val1": "520.16",
          "val2": "325.80",
          "chgp": "59.66%",
          "chgp_class": "positive"
        },
        {
          "field": "Operating Profit (PBDIT) excl Other Income",
          "val1": "114.28",
          "val2": "62.72",
          "chgp": "82.21%",
          "chgp_class": "positive"
        },
        {
          "field": "Interest",
          "val1": "18.35",
          "val2": "13.17",
          "chgp": "39.33%",
          "chgp_class": "negative"
        },
        {
          "field": "Exceptional Items",
          "val1": "0.00",
          "val2": "0.00",
          "chgp": "",
          "chgp_class": "neutral"
        },
        {
          "field": "Consolidate Net Profit",
          "val1": "61.37",
          "val2": "43.15",
          "chgp": "42.22%",
          "chgp_class": "positive"
        },
        {
          "field": "Operating Profit Margin (Excl OI)",
          "val1": "21.97%",
          "val2": "19.25%",
          "chgp": "2.72%",
          "chgp_class": "positive"
        }
      ]
    }
  },
  {
    "link": "nine-monthly",
    "btn_text": "All Nine Monthly Results",
    "header": "Nine Monthly Results Snapshot (Consolidated) - Dec'25",
    "rhs": [
      {
        "prefix": "Net Sales ",
        "suffix": "YoY Growth in nine months ended Dec 2025 is 60.91% vs 102.36% in Dec 2024",
        "dir": -1
      },
      {
        "prefix": "Consolidated Net Profit ",
        "suffix": "YoY Growth in nine months ended Dec 2025 is 47.71% vs 112.79% in Dec 2024",
        "dir": -1
      }
    ],
    "table": {
      "header": [
        "Dec'25",
        "Dec'24",
        "Change(%)"
      ],
      "body": [
        {
          "field": "Net Sales",
          "val1": "865.12",
          "val2": "537.64",
          "chgp": "60.91%",
          "chgp_class": "positive"
        },
        {
          "field": "Operating Profit (PBDIT) excl Other Income",
          "val1": "188.90",
          "val2": "106.03",
          "chgp": "78.16%",
          "chgp_class": "positive"
        },
        {
          "field": "Interest",
          "val1": "29.42",
          "val2": "20.13",
          "chgp": "46.15%",
          "chgp_class": "negative"
        },
        {
          "field": "Exceptional Items",
          "val1": "0.00",
          "val2": "0.00",
          "chgp": "",
          "chgp_class": "neutral"
        },
        {
          "field": "Consolidate Net Profit",
          "val1": "102.72",
          "val2": "69.54",
          "chgp": "47.71%",
          "chgp_class": "positive"
        },
        {
          "field": "Operating Profit Margin (Excl OI)",
          "val1": "21.84%",
          "val2": "19.72%",
          "chgp": "2.12%",
          "chgp_class": "positive"
        }
      ]
    }
  },
  {
    "link": "annual",
    "btn_text": "All Annual Results",
    "header": "Annual Results Snapshot (Consolidated) - Mar'26",
    "rhs": [
      {
        "prefix": "Net Sales ",
        "suffix": "YoY Growth in year ended Mar 2026 is 59.43% vs 98.55% in Mar 2025",
        "dir": -1
      },
      {
        "prefix": "Consolidated Net Profit ",
        "suffix": "YoY Growth in year ended Mar 2026 is 57.29% vs 97.75% in Mar 2025",
        "dir": -1
      }
    ],
    "table": {
      "header": [
        "Mar'26",
        "Mar'25",
        "Change(%)"
      ],
      "body": [
        {
          "field": "Net Sales",
          "val1": "1,497.09",
          "val2": "939.05",
          "chgp": "59.43%",
          "chgp_class": "positive"
        },
        {
          "field": "Operating Profit (PBDIT) excl Other Income",
          "val1": "319.98",
          "val2": "176.68",
          "chgp": "81.11%",
          "chgp_class": "positive"
        },
        {
          "field": "Interest",
          "val1": "45.66",
          "val2": "28.72",
          "chgp": "58.98%",
          "chgp_class": "negative"
        },
        {
          "field": "Exceptional Items",
          "val1": "0.00",
          "val2": "0.00",
          "chgp": "",
          "chgp_class": "neutral"
        },
        {
          "field": "Consolidate Net Profit",
          "val1": "181.40",
          "val2": "115.33",
          "chgp": "57.29%",
          "chgp_class": "positive"
        },
        {
          "field": "Operating Profit Margin (Excl OI)",
          "val1": "21.37%",
          "val2": "18.81%",
          "chgp": "2.56%",
          "chgp_class": "positive"
        }
      ]
    }
  }
]

Quarterly Results Snapshot (Consolidated) - Jun'26 - YoYstock-summary

Jun'26
Jun'25
Change(%)
Net Sales
519.46
219.54
136.61%
Operating Profit (PBDIT) excl Other Income
60.54
48.57
24.64%
Interest
15.43
9.35
65.03%
Exceptional Items
0.00
0.00
Consolidate Net Profit
26.08
25.42
2.60%
Operating Profit Margin (Excl OI)
11.65%
22.12%
-10.47%
Values in Rs Cr.
Direction Arrows
Net Sales

YoY Growth in quarter ended Jun 2026 is 136.61% vs 72.62% in Jun 2025

Direction Arrows
Consolidated Net Profit

YoY Growth in quarter ended Jun 2026 is 2.60% vs 39.59% in Jun 2025

Half Yearly Results Snapshot (Consolidated) - Sep'25stock-summary

Sep'25
Sep'24
Change(%)
Net Sales
520.16
325.80
59.66%
Operating Profit (PBDIT) excl Other Income
114.28
62.72
82.21%
Interest
18.35
13.17
39.33%
Exceptional Items
0.00
0.00
Consolidate Net Profit
61.37
43.15
42.22%
Operating Profit Margin (Excl OI)
21.97%
19.25%
2.72%
Values in Rs Cr.
Direction Arrows
Net Sales

Growth in half year ended Sep 2025 is 59.66% vs 77.82% in Sep 2024

Direction Arrows
Consolidated Net Profit

Growth in half year ended Sep 2025 is 42.22% vs 84.24% in Sep 2024

Nine Monthly Results Snapshot (Consolidated) - Dec'25stock-summary

Dec'25
Dec'24
Change(%)
Net Sales
865.12
537.64
60.91%
Operating Profit (PBDIT) excl Other Income
188.90
106.03
78.16%
Interest
29.42
20.13
46.15%
Exceptional Items
0.00
0.00
Consolidate Net Profit
102.72
69.54
47.71%
Operating Profit Margin (Excl OI)
21.84%
19.72%
2.12%
Values in Rs Cr.
Direction Arrows
Net Sales

YoY Growth in nine months ended Dec 2025 is 60.91% vs 102.36% in Dec 2024

Direction Arrows
Consolidated Net Profit

YoY Growth in nine months ended Dec 2025 is 47.71% vs 112.79% in Dec 2024

Annual Results Snapshot (Consolidated) - Mar'26stock-summary

Mar'26
Mar'25
Change(%)
Net Sales
1,497.09
939.05
59.43%
Operating Profit (PBDIT) excl Other Income
319.98
176.68
81.11%
Interest
45.66
28.72
58.98%
Exceptional Items
0.00
0.00
Consolidate Net Profit
181.40
115.33
57.29%
Operating Profit Margin (Excl OI)
21.37%
18.81%
2.56%
Values in Rs Cr.
Direction Arrows
Net Sales

YoY Growth in year ended Mar 2026 is 59.43% vs 98.55% in Mar 2025

Direction Arrows
Consolidated Net Profit

YoY Growth in year ended Mar 2026 is 57.29% vs 97.75% in Mar 2025

stock-summaryCompany CV
About K.P. Energy Ltd stock-summary
stock-summary
K.P. Energy Ltd
Small Cap
Power
K P Energy Limited, formerly known as K P Buildcon Limited, is part of a KP Group which is founded by Faruk Gulambhai Patel in 1994. K P Energy Limited was originally incorporated as Private limited Company on 8 January, 2010 and then converted into Public Limited Company on 11 May, 2015. KP Energy Limited is a leading provider of Balance of Plant (BoP) solutions for the wind energy industry.
Company Coordinates stock-summary
Company Details
A-1/2 Firdos Tower, Adajan Patia Surat Gujarat : 395009
stock-summary
Tel: 91-261-2764757
stock-summary
info@kpenergy.in
Registrar Details
Bigshare Services Pvt Ltd , E-2 , Ansa Industrial Estate, Saki Vihar Road, Saki Naka, Andheri (E), Mumbai