
Compare Kalyani Steels with Similar Stocks
Dashboard
Company has a Debt to Equity ratio (avg) of 0.01 times
Poor long term growth as Net Sales has grown by an annual rate of 9.21% and Operating profit at 6.77% over the last 5 years
Flat results in Mar 26
With ROE of 12.4, it has a Expensive valuation with a 1.7 Price to Book Value
Majority shareholders : Promoters
Stock DNA
Iron & Steel Products
INR 3,606 Cr (Small Cap)
14.00
26
1.20%
-0.14
12.43%
1.74
Total Returns (Price + Dividend) 
Latest dividend: 10.027711797307997 per share ex-dividend date: Aug-11-2025
Risk Adjusted Returns v/s
Returns Beta

News
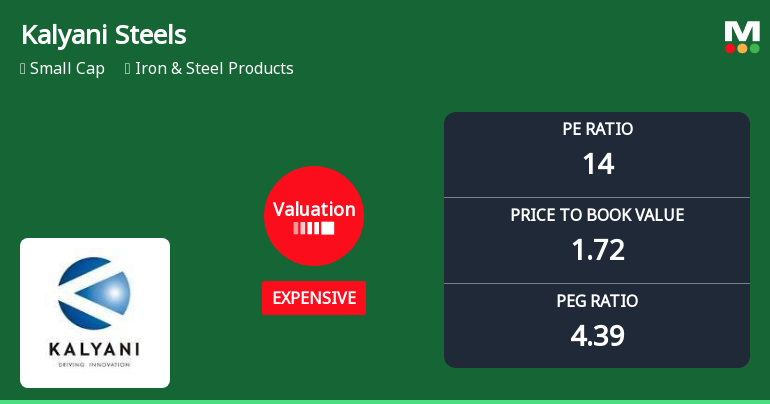
Kalyani Steels Ltd Valuation Shifts: Price Attractiveness Under Scrutiny
Kalyani Steels Ltd has witnessed a notable shift in its valuation parameters, moving from a fair to an expensive rating, reflecting a change in price attractiveness. Despite solid operational metrics and strong long-term returns, the stock’s elevated price-to-earnings and price-to-book ratios relative to historical and peer averages suggest a cautious stance for investors.
Read full news article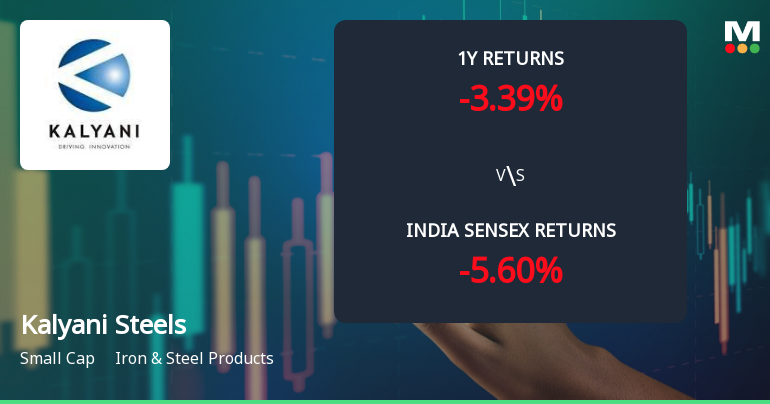
Kalyani Steels Ltd Technical Momentum Shifts Signal Bullish Outlook
Kalyani Steels Ltd has demonstrated a notable shift in its technical momentum, moving from a mildly bullish stance to a more confident bullish trend. This change is underpinned by a combination of technical indicators including MACD, RSI, moving averages, and Bollinger Bands, signalling a potential uptrend for this iron and steel products small-cap stock amid a mixed market backdrop.
Read full news article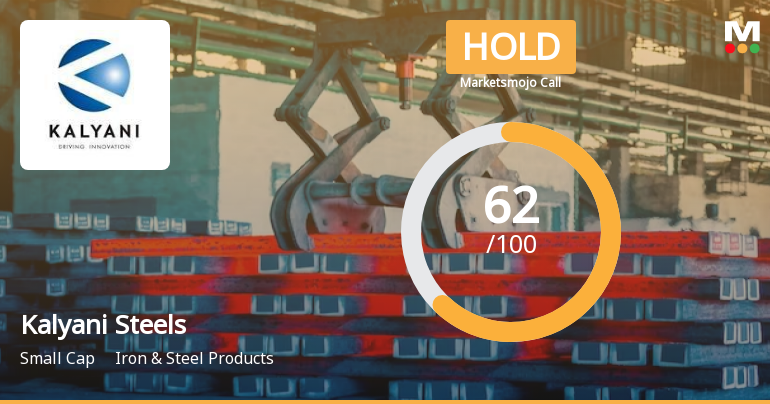
Kalyani Steels Ltd is Rated Hold by MarketsMOJO
Kalyani Steels Ltd is rated 'Hold' by MarketsMOJO, with this rating last updated on 08 June 2026. However, the analysis and financial metrics discussed here reflect the company’s current position as of 20 June 2026, providing investors with the latest insights into its performance and outlook.
Read full news article Announcements
Announcement under Regulation 30 (LODR)-Newspaper Publication
22-Jun-2026 | Source : BSEAnnouncement U/R 30 of SEBI LODR - IEPF Notice
Announcement U/R 30 Of SEBI LODR- Proceedings Of Postal Ballot
22-Jun-2026 | Source : BSEAnnouncement U/R 30 of SEBI LODR- Proceedings of Postal Ballot
Shareholder Meeting / Postal Ballot-Scrutinizers Report
22-Jun-2026 | Source : BSEVoting Result of Postal Ballot
Corporate Actions

No Upcoming Board Meetings

Kalyani Steels Ltd has declared 200% dividend, ex-date: 11 Aug 25

No Splits history available

No Bonus history available

No Rights history available
Quality key factors
Valuation key factors
Technicals key factors
 Technical Indicator Scale: Bearish, Mildly Bearish, Sideways, Mildly Bullish, Bullish Turned
 Shareholding Snapshot : Mar 2026
Shareholding Compare (%holding)
Promoters
None
Held by 6 Schemes (11.05%)
Held by 47 FIIs (1.82%)
Bf Investment Limited (39.06%)
Quant Mutual Fund A/c Quant Infrastructure Fund (5.99%)
17.13%
Quarterly Results Snapshot (Standalone) - Mar'26 - QoQ

QoQ Growth in quarter ended Mar 2026 is 4.76% vs 1.38% in Dec 2025
QoQ Growth in quarter ended Mar 2026 is 15.83% vs -0.81% in Dec 2025
Half Yearly Results Snapshot (Consolidated) - Sep'25
Not Applicable: The company has declared_date for only one period
Not Applicable: The company has declared_date for only one period
Nine Monthly Results Snapshot (Consolidated) - Dec'25

YoY Growth in nine months ended Dec 2025 is -5.31% vs 14.34% in Dec 2024
YoY Growth in nine months ended Dec 2025 is 5.76% vs 0.88% in Dec 2024
Annual Results Snapshot (Consolidated) - Mar'26
YoY Growth in year ended Mar 2026 is -6.88% vs 1.14% in Mar 2025
YoY Growth in year ended Mar 2026 is 0.63% vs 3.00% in Mar 2025
About Kalyani Steels Ltd

Company Coordinates


