
Compare KNR Construct. with Similar Stocks
Total Returns (Price + Dividend) 
Latest dividend: 0.24 per share ex-dividend date: Sep-15-2025
Risk Adjusted Returns v/s
Returns Beta

News

KNR Constructions Ltd is Rated Sell by MarketsMOJO
KNR Constructions Ltd is rated 'Sell' by MarketsMOJO, with this rating last updated on 30 May 2025. However, the analysis and financial metrics discussed here reflect the company’s current position as of 03 June 2026, providing investors with an up-to-date perspective on the stock’s performance and outlook.
Read full news articleAre KNR Constructions Ltd latest results good or bad?
KNR Constructions Ltd's latest financial results for Q4 FY26 reveal a complex operational landscape. The company reported consolidated net profit of ₹106.21 crore, reflecting a year-on-year decline of 23.72%. This decline is notable, especially as it marks the fourth consecutive quarter of year-on-year revenue contraction, with net sales dropping to ₹695.59 crore, down 28.67% from the previous year. Despite these challenges, there are signs of operational resilience. The operating margin, excluding other income, improved to 24.31%, up from 22.71% in the same quarter last year, indicating effective cost management amidst declining revenues. Additionally, the profit after tax (PAT) margin expanded significantly to 13.46%, although this was partly influenced by a normalised tax rate compared to the previous year’s exceptionally high rate. The company's performance also shows a slight sequential improvement ...
Read full news article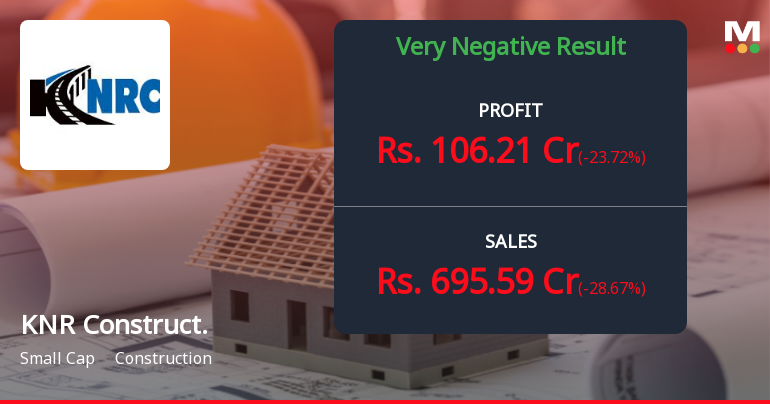
KNR Constructions Q4 FY26: Profit Resilience Amid Revenue Headwinds
KNR Constructions Ltd., a leading infrastructure developer specialising in highways, flyovers, and irrigation projects, reported consolidated net profit of ₹106.21 crores for Q4 FY26, down 23.72% year-on-year from ₹139.24 crores in Q4 FY25. The quarter witnessed significant revenue contraction, with net sales declining 28.67% YoY to ₹695.59 crores from ₹975.21 crores, reflecting execution challenges in the company's project pipeline. Despite the revenue headwinds, the stock has declined 3.99% following the results announcement, trading at ₹126.35 and extending its year-long downtrend.
Read full news article Announcements
Announcement under Regulation 30 (LODR)-Award_of_Order_Receipt_of_Order
06-Jun-2026 | Source : BSEIntimation of receipt of order
Announcement under Regulation 30 (LODR)-Earnings Call Transcript
06-Jun-2026 | Source : BSETranscript for Earnings call for Q4FY26
Announcement under Regulation 30 (LODR)-Newspaper Publication
01-Jun-2026 | Source : BSENewspaper publication of audited financial results for the financial year ended 31st March 2026
Corporate Actions

No Upcoming Board Meetings

KNR Constructions Ltd has declared 12% dividend, ex-date: 15 Sep 25

KNR Constructions Ltd has announced 2:10 stock split, ex-date: 13 Dec 16

KNR Constructions Ltd has announced 1:1 bonus issue, ex-date: 03 Feb 21

No Rights history available
Quality key factors
Valuation key factors
Technicals key factors
 Technical Indicator Scale: Bearish, Mildly Bearish, Sideways, Mildly Bullish, Bullish Turned
 Shareholding Snapshot : Mar 2026
Shareholding Compare (%holding)
Promoters
None
Held by 16 Schemes (18.85%)
Held by 68 FIIs (6.29%)
Kamidi Narsimha Reddy (30.4%)
Icici Prduential Infrastructure Fund (4.73%)
22.22%
Quarterly Results Snapshot (Consolidated) - Mar'26 - YoY

YoY Growth in quarter ended Mar 2026 is -28.67% vs -31.03% in Mar 2025
YoY Growth in quarter ended Mar 2026 is -23.72% vs -60.59% in Mar 2025
Half Yearly Results Snapshot (Consolidated) - Sep'25

Growth in half year ended Sep 2025 is -57.02% vs 45.08% in Sep 2024
Growth in half year ended Sep 2025 is -62.86% vs 115.85% in Sep 2024
Nine Monthly Results Snapshot (Consolidated) - Dec'25
YoY Growth in nine months ended Dec 2025 is -47.00% vs 25.29% in Dec 2024
YoY Growth in nine months ended Dec 2025 is -61.64% vs 103.41% in Dec 2024
Annual Results Snapshot (Consolidated) - Mar'26
YoY Growth in year ended Mar 2026 is -43.24% vs 7.31% in Mar 2025
YoY Growth in year ended Mar 2026 is -56.37% vs 28.87% in Mar 2025
About KNR Constructions Ltd

Company Coordinates


