
Compare Konndor Indust. with Similar Stocks
Dashboard
With a Operating Losses, the company has a Weak Long Term Fundamental Strength
- Company's ability to service its debt is weak with a poor EBIT to Interest (avg) ratio of 0.54
- The company has been able to generate a Return on Equity (avg) of 4.93% signifying low profitability per unit of shareholders funds
Flat results in Dec 25
Risky - Negative EBITDA
Stock DNA
Paper, Forest & Jute Products
INR 12 Cr (Micro Cap)
NA (Loss Making)
23
0.00%
0.00
-0.31%
1.24
Total Returns (Price + Dividend) 
Konndor Indust. for the last several years.
Risk Adjusted Returns v/s
Returns Beta

News
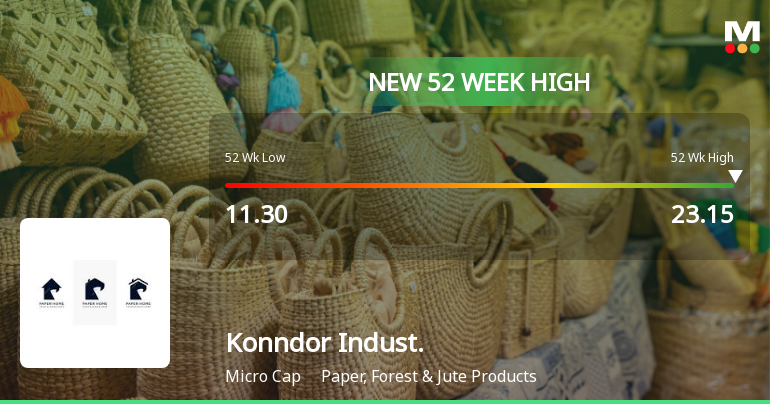
Broad-Based Technical Strength Lifts Konndor Industries Ltd to 52-Week High of Rs 23.15
Surging to a fresh 52-week high of Rs 23.15 on 18 Jun 2026, Konndor Industries Ltd has demonstrated remarkable price momentum, outperforming its sector and the broader market. This milestone caps a four-day winning streak that has propelled the stock up by 21.52%, underscoring a strong technical backdrop that has investors and analysts alike taking note.
Read full news article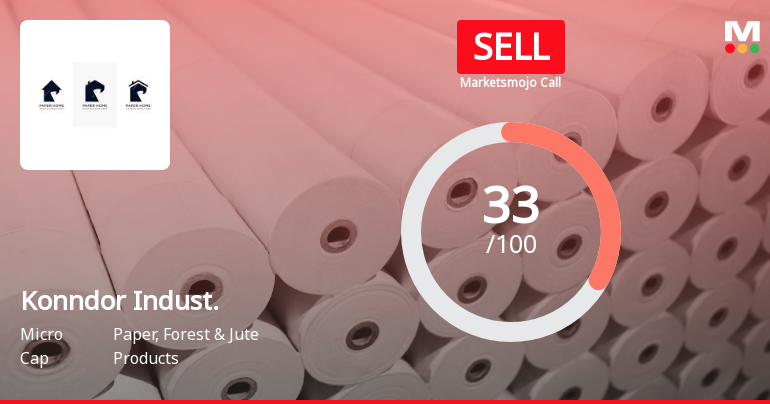
Konndor Industries Ltd Upgraded to Sell on Technical Improvements Despite Weak Fundamentals
Konndor Industries Ltd, a micro-cap player in the Paper, Forest & Jute Products sector, has seen its investment rating upgraded from Strong Sell to Sell as of 15 June 2026. This change is primarily driven by a shift in technical indicators signalling a mildly bullish trend, despite persistent fundamental weaknesses and valuation concerns. The company’s stock has delivered market-beating returns over multiple timeframes, yet operational challenges and financial strain continue to weigh on its outlook.
Read full news article Announcements
Closure of Trading Window
26-Mar-2026 | Source : BSEClosing of trading window for the quarter and annual audited financial results ended 31.03.2026.
Board Meeting Outcome for Outcome Of Board Meeting Of Resignation Of Mr. Vimal Mafatlal Patel As A Director.
06-Mar-2026 | Source : BSEOutcome of Board meeting of Resignation of Mr. Vimal Mafatlal Patel as a Director.
Announcement under Regulation 30 (LODR)-Cessation
06-Mar-2026 | Source : BSERESIGNATION OF VIMAL MAFATLAL PATEL
Corporate Actions

No Upcoming Board Meetings

No Dividend history available

No Splits history available

No Bonus history available

No Rights history available
Quality key factors
Valuation key factors
Technicals key factors
 Technical Indicator Scale: Bearish, Mildly Bearish, Sideways, Mildly Bullish, Bullish Turned
 Shareholding Snapshot : Dec 2025
Shareholding Compare (%holding)
Non Institution
None
Held by 0 Schemes
Held by 0 FIIs
None
Yashashri Subodh Jadhav (19.24%)
71.69%
Quarterly Results Snapshot (Standalone) - Dec'25 - QoQ

QoQ Growth in quarter ended Dec 2025 is 0.00% vs -100.00% in Sep 2025

QoQ Growth in quarter ended Dec 2025 is 0.00% vs 100.00% in Sep 2025
Half Yearly Results Snapshot (Standalone) - Sep'25
Growth in half year ended Sep 2025 is -60.46% vs -30.62% in Sep 2024
Growth in half year ended Sep 2025 is -102.99% vs 26.42% in Sep 2024
Nine Monthly Results Snapshot (Standalone) - Dec'25
YoY Growth in nine months ended Dec 2025 is -75.16% vs -27.04% in Dec 2024
YoY Growth in nine months ended Dec 2025 is -103.80% vs 6.76% in Dec 2024
Annual Results Snapshot (Standalone) - Mar'25
YoY Growth in year ended Mar 2025 is -35.61% vs 19.60% in Mar 2024
YoY Growth in year ended Mar 2025 is 1.56% vs 137.04% in Mar 2024
About Konndor Industries Ltd

Company Coordinates


