
Compare LG Electronics with Similar Stocks
Dashboard
High Management Efficiency with a high ROE of 0%
The company is Net-Debt Free
Poor long term growth as Operating profit has grown by an annual rate 0% of over the last 5 years
Flat results in Mar 26
With ROE of 28.2, it has a Expensive valuation with a 17.6 Price to Book Value
Increasing Participation by Institutional Investors
With its market cap of Rs 1,03,649 cr, it is the biggest company in the sector and constitutes 69.60% of the entire sector
Stock DNA
Electronics & Appliances
INR 104,107 Cr (Large Cap)
62.00
53
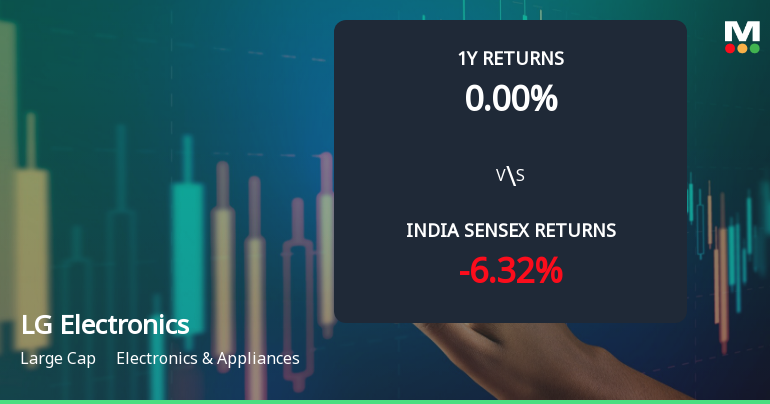
0.00%
-0.63
28.23%
17.36
Total Returns (Price + Dividend) 
LG Electronics for the last several years.
Risk Adjusted Returns v/s
Returns Beta

News
LG Electronics India Ltd Technical Momentum Shifts Amid Sideways Trend
LG Electronics India Ltd has experienced a notable shift in its technical momentum, moving from a mildly bullish stance to a sideways trend, reflecting a period of consolidation after recent price fluctuations. Despite a modest decline in the latest session, the stock’s technical indicators present a nuanced picture that investors should carefully analyse amid broader market conditions.
Read full news article
LG Electronics India Ltd is Rated Hold
LG Electronics India Ltd is rated 'Hold' by MarketsMOJO. This rating was last updated on 09 June 2026, reflecting a shift from a previous 'Sell' rating. However, the analysis and financial metrics discussed here represent the stock's current position as of 13 July 2026, providing investors with the latest insights into the company’s performance and outlook.
Read full news article
LG Electronics India Ltd is Rated Hold
LG Electronics India Ltd is rated 'Hold' by MarketsMOJO, with this rating last updated on 09 June 2026. However, the analysis and financial metrics discussed here reflect the stock's current position as of 02 July 2026, providing investors with the latest insights into the company’s performance and outlook.
Read full news article Announcements
Corporate Actions

No Upcoming Board Meetings

No Dividend history available

No Splits history available

No Bonus history available

No Rights history available
Quality key factors
Valuation key factors
Technicals key factors
 Technical Indicator Scale: Bearish, Mildly Bearish, Sideways, Mildly Bullish, Bullish Turned
 Shareholding Snapshot : Mar 2026
Shareholding Compare (%holding)
Promoters
None
Held by 36 Schemes (6.01%)
Held by 126 FIIs (2.73%)
Lg Electronics Inc (85.0%)
Icici Prudential Mutual Fund - Icici Prudential Ni (1.15%)
3.73%
Quarterly Results Snapshot (Standalone) - Mar'26 - QoQ

QoQ Growth in quarter ended Mar 2026 is 95.74% vs -33.36% in Dec 2025
QoQ Growth in quarter ended Mar 2026 is 672.53% vs -76.97% in Dec 2025
Half Yearly Results Snapshot (Standalone) - Sep'25
Not Applicable: The company has declared_date for only one period
Not Applicable: The company has declared_date for only one period
Nine Monthly Results Snapshot (Standalone) - Dec'25
Not Applicable: The company has declared_date for only one period
Not Applicable: The company has declared_date for only one period
Annual Results Snapshot (Standalone) - Mar'26

YoY Growth in year ended Mar 2026 is 0.98% vs 14.12% in Mar 2025
YoY Growth in year ended Mar 2026 is -23.52% vs 45.81% in Mar 2025
About LG Electronics India Ltd

Company Coordinates


