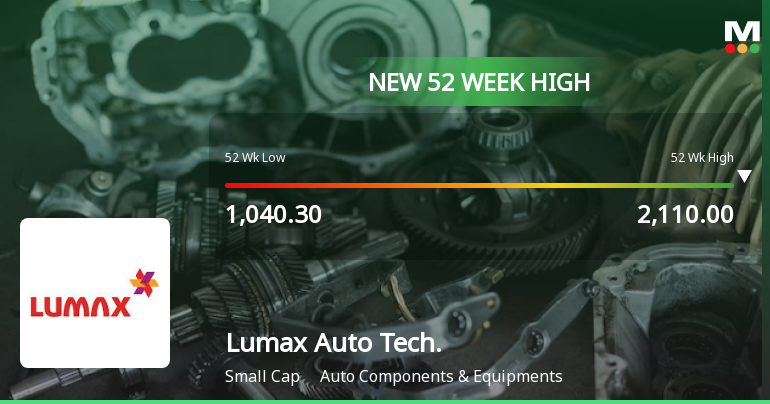
Lumax Auto Tech.

  • Market Cap: Small Cap
  • Industry: Auto Components & Equipments
  • ISIN: INE872H01027
  • NSEID: LUMAXTECH
  • BSEID: 532796
INR
1,938.90
-51.25 (-2.58%)
BSENSE

Sep 10, 03:50 PM

BSE+NSE Vol: 86.3 k

  • Price Points
  • Score
  • Mojo Parameters
  • Total Return
  • News and Corporate Actions
  • Key factors
  • Shareholding
  • Financials
  • CompanyCV
stock-summaryPrice Point
High/Low

1Day

52 Week

Valuation
Technical
Day's Volume

CASH

86.3 k (-26.92%) Volume

Shareholding (Jun 2026)

FII

8.69%

Held by 132 FIIs

DII

16.53%

Held by 18 DIIs

Promoter

55.98%

Why is Lumax Auto Technologies Ltd falling/rising?

06-Sep-2026

As of 05-Sep, Lumax Auto Technologies Ltd's stock is experiencing a decline of -1.56% and has underperformed for four consecutive days, totaling a -6.45% drop. Despite strong long-term gains, recent trends and decreased investor participation suggest ongoing short-term challenges.

As of 05-Sep, Lumax Auto Technologies Ltd's stock price is currently falling, as indicated by a change of -31.0, or -1.56%. The stock has been underperforming, having lost value for the last four consecutive days, resulting in a total decline of -6.45% during this period. Additionally, the stock's performance today has underperformed its sector by -1.84%. <BR><BR>Investor participation appears to be declining, with the delivery volume on 03 September dropping by -46.26% compared to the 5-day average. This decrease in trading activity suggests a lack of interest among investors, which could contribute to the stock's downward movement. <BR><BR>Despite the stock's strong long-term performance, including a 26.63% increase year-to-date and an impressive 84.73% rise over the past year, the recent trends indicate a short-term decline. The stock is currently trading below its 5-day and 20-day moving averages, although it remains above the 50-day, 100-day, and 200-day moving averages. This mixed technical picture, combined with falling investor participation, is likely influencing the current decline in stock price.

View full answer

Who are in the management team of Lumax Auto Tech.?

01-Sep-2026

The management team of Lumax Auto Tech includes D K Jain (Executive Chairman), Anmol Jain (Managing Director), and several non-executive and independent directors, such as Roop Salotra and Milap Jain, among others, who guide the company's strategic direction and ensure regulatory compliance.

The management team of Lumax Auto Tech includes the following individuals:<BR><BR>1. **D K Jain** - Executive Chairman<BR>2. **Anmol Jain** - Managing Director<BR>3. **Deepak Jain** - Non-Executive & Non-Independent Director<BR>4. **Roop Salotra** - Non-Executive & Independent Director<BR>5. **Milap Jain** - Non-Executive & Independent Director<BR>6. **Sanjay Mehta** - Non-Executive & Non-Independent Director<BR>7. **Arun Malhotra** - Non-Executive & Independent Director<BR>8. **Avinash Prakash Gandhi** - Non-Executive & Independent Director<BR>9. **Pankaj Mahendru** - Company Secretary & Compliance Officer<BR>10. **Diviya Chanana** - Independent Director<BR><BR>This team plays a crucial role in guiding the company's strategic direction and ensuring compliance with regulatory standards.

View full answer

What does Lumax Auto Tech. do?

01-Sep-2026

Lumax Auto Technologies Ltd is a small-cap company in the Auto Components & Equipments industry, specializing in automotive electrical products. As of June 2026, it reported net sales of ₹1,364 Cr and a net profit of ₹87 Cr.

Overview:<BR>Lumax Auto Technologies Ltd operates in the Auto Components & Equipments industry and is categorized as a Small Cap company.<BR><BR>History:<BR>The company was incorporated on October 30, 1981, initially as Lumax Auto-Electricals Pvt Ltd. It underwent several name changes, becoming Dhanesh Auto Electricals Pvt Ltd in 1988, then Dhanesh Auto Electricals Ltd in 2002 after converting to a public limited company, and finally rebranding to Lumax Auto Technologies Ltd. The latest quarterly results reported are for June 2026, showing net sales and profit figures.<BR><BR>Financial Snapshot:<BR>- Net Sales: 1,364 Cr (Quarterly Results - Jun 2026)<BR>- Net Profit: 87 Cr (Quarterly Results - Jun 2026)<BR>- Market Cap: INR 13,479 Cr (Small Cap)<BR><BR>Key Metrics:<BR>- P/E: 42.00<BR>- Industry P/E: 41<BR>- Dividend Yield: 0.28%<BR>- Debt Equity: 0.73<BR>- Return on Equity: 24.25%<BR>- Price to Book: 11.06<BR><BR>Contact Details:<BR>Address: Plot No 70 Sector No 10, PCNTDA Bhosari Industrial Area Pune Maharashtra : 411026<BR>Tel: 91-20-66304606/66304617<BR>Email: shares@lumaxautotech.com<BR>Website: http://www.lumaxautotech.com

View full answer

Who are the peers of the Lumax Auto Tech.?

01-Sep-2026

Lumax Auto Tech.'s peers include Minda Corp, Amara Raja Ener., CIE Automotive, JBM Auto, Ramkrishna Forg., ASK Automotive, Varroc Engineer, Pricol Ltd, and Banco Products. Lumax Auto Tech. leads in 1-year returns at 77.26%, while Amara Raja Ener. has the lowest at -9.88%.

Peers: The peers of Lumax Auto Tech. are Minda Corp, Amara Raja Ener., CIE Automotive, JBM Auto, Ramkrishna Forg., ASK Automotive, Varroc Engineer, Pricol Ltd, and Banco Products.<BR><BR>Quality Snapshot: Excellent management risk is observed at Minda Corp, Amara Raja Ener., CIE Automotive, JBM Auto, Ramkrishna Forg., ASK Automotive, Varroc Engineer, Pricol Ltd, and Banco Products, while Average management risk is found at JBM Auto and Banco Products. Growth is excellent at Minda Corp, JBM Auto, ASK Automotive, and Lumax Auto Tech., while below average growth is noted for Amara Raja Ener., CIE Automotive, and Ramkrishna Forg. Capital structure is excellent at Amara Raja Ener., CIE Automotive, ASK Automotive, and Pricol Ltd, while below average capital structure is observed at JBM Auto, Ramkrishna Forg., and Varroc Engineer.<BR><BR>Return Snapshot: The peer with the highest 1-year return is Lumax Auto Tech. at 77.26%, while the lowest is Amara Raja Ener. at -9.88%. Lumax Auto Tech.'s return significantly outperforms all peers. Additionally, CIE Automotive and Banco Products have negative six-month returns.

View full answer

How big is Lumax Auto Tech.?

01-Sep-2026

As of 31st August, Lumax Auto Technologies Ltd has a market capitalization of 13,479.00 Cr, with net sales of 5207.57 Cr and a net profit of 324.08 Cr reported in the latest four quarters.

As of 31st August, Lumax Auto Technologies Ltd has a market capitalization of 13,479.00 Cr, classifying it as a Small Cap company.<BR><BR>In the latest four quarters, Lumax Auto Technologies Ltd reported net sales of 5207.57 Cr and a net profit of 324.08 Cr.<BR><BR>The latest annual period for the balance sheet is March 2026, with shareholder's funds amounting to 1,210.22 Cr and total assets valued at 3,946.94 Cr.

View full answer

Should I buy, sell or hold Lumax Auto Technologies Ltd?

12-Aug-2026

Are Lumax Auto Technologies Ltd latest results good or bad?

30-May-2026

Lumax Auto Technologies Ltd's latest results are positive, with a 50.94% increase in net profit and record net sales of ₹1,416.93 crores. However, analysts recommend a "HOLD" rating due to high valuation multiples, suggesting caution for new investors.

Lumax Auto Technologies Ltd's latest results are generally positive, showcasing strong operational performance. In the fourth quarter of FY26, the company reported a consolidated net profit of ₹88.12 crores, which reflects a significant year-on-year increase of 50.94%. Additionally, net sales reached an all-time high of ₹1,416.93 crores, marking a 25.07% increase compared to the same quarter last year.<BR><BR>The operating margin also improved, reaching 14.34%, which is a record for the company. This indicates enhanced operational efficiency and effective cost management. Furthermore, the return on equity (ROE) stands at a robust 20.04%, highlighting strong capital efficiency.<BR><BR>However, despite these positive results, analysts have issued a "HOLD" rating due to the company's stretched valuation multiples. The stock trades at a high P/E ratio of 44.64, which may limit upside potential for new investors. Therefore, while the operational metrics are impressive, the elevated valuations suggest caution for those considering new investments. Existing shareholders might continue to hold their positions, but it's advisable to monitor the rising interest costs and overall market conditions.

View full answer

When is the next results date for Lumax Auto Technologies Ltd?

03-Feb-2026

The next results date for Lumax Auto Technologies Ltd is 12 February 2026.

The next results date for Lumax Auto Technologies Ltd is scheduled for 12 February 2026.

View full answer

Is Lumax Auto Tech. technically bullish or bearish?

11-Nov-2025

As of November 10, 2025, Lumax Auto Tech's trend is bullish with moderate strength, supported by positive daily moving averages and strong returns compared to the Sensex, though caution is advised due to some bearish signals in the MACD, KST, and RSI.

As of 10 November 2025, the technical trend for Lumax Auto Tech has changed from mildly bullish to bullish. The current stance is bullish with moderate strength. Key indicators driving this include the daily moving averages which are bullish, and both the Bollinger Bands and Dow Theory indicating bullish trends on the weekly and monthly time frames. However, the MACD and KST on the weekly are mildly bearish, and the RSI on the monthly is bearish, suggesting some caution. Overall, the strong performance in returns compared to the Sensex further supports the bullish outlook.

View full answer

How has been the historical performance of Lumax Auto Tech.?

09-Nov-2025

Lumax Auto Tech has shown significant growth from Mar'21 to Mar'25, with net sales increasing from 1,107.93 Cr to 3,636.67 Cr, and profit after tax rising from 51.24 Cr to 229.16 Cr. The company's total assets also grew from 989.57 Cr to 3,235.22 Cr, reflecting robust operational expansion.

Answer:<BR>The historical performance of Lumax Auto Tech shows significant growth in various financial metrics over the years.<BR><BR>Breakdown:<BR>Lumax Auto Tech has demonstrated a strong upward trend in net sales, increasing from 1,107.93 Cr in Mar'21 to 3,636.67 Cr in Mar'25. This growth is accompanied by a rise in total operating income, which also surged from 1,107.93 Cr in Mar'21 to 3,636.67 Cr in Mar'25. The company's total expenditure, excluding depreciation, rose from 1,009.92 Cr in Mar'21 to 3,171.90 Cr in Mar'25, reflecting the increased scale of operations. Operating profit (PBDIT) has similarly improved, climbing from 98.01 Cr in Mar'21 to 464.77 Cr in Mar'25, while profit before tax increased from 71.59 Cr to 308.16 Cr over the same period. The profit after tax also saw a notable rise, from 51.24 Cr in Mar'21 to 229.16 Cr in Mar'25. The earnings per share (EPS) rose from 6.92 in Mar'21 to 26.09 in Mar'25, indicating enhanced profitability per share. On the balance sheet, total assets grew from 989.57 Cr in Mar'21 to 3,235.22 Cr in Mar'25, while total liabilities increased from 72.37 Cr to 768.39 Cr, reflecting the company's expansion. Cash flow from operating activities improved from 98.00 Cr in Mar'21 to 290.00 Cr in Mar'25, contributing to a positive net cash inflow in the latest year. Overall, Lumax Auto Tech's financial performance indicates robust growth and operational scaling over the past several years.

View full answer

Is Lumax Auto Tech. overvalued or undervalued?

09-Jun-2025

As of June 2, 2025, Lumax Auto Tech. is considered overvalued with a PE ratio of 36.91 and a Price to Book Value of 7.86, indicating it trades at a premium compared to peers and the industry, despite having significantly outperformed the Sensex with a 90.76% return over the past year.

As of 2 June 2025, the valuation grade for Lumax Auto Tech. has moved from fair to expensive, indicating a shift towards overvaluation. The company is currently assessed as overvalued based on its key financial ratios, including a PE ratio of 36.91, a Price to Book Value of 7.86, and an EV to EBITDA ratio of 14.98. These figures suggest that the stock is trading at a premium compared to its earnings and book value.<BR><BR>In comparison to its peers, Lumax Auto Tech. has a higher PE ratio than Samvardhana Motherson, which stands at 29.14, and a significantly higher EV to EBITDA ratio compared to the industry average. Other competitors like Bosch and Uno Minda also reflect expensive valuations, but Lumax's ratios still indicate that it is on the higher end of the spectrum. Notably, Lumax Auto Tech. has outperformed the Sensex significantly over various time frames, including a 90.76% return over the past year, reinforcing the notion of its current overvaluation.

View full answer

Who are the top shareholders of the Lumax Auto Tech.?

06-Jun-2025

The top shareholders of Lumax Auto Tech include promoter Deepak Jain with 18.96%, mutual funds with 13.71%, Foreign Institutional Investors (FIIs) at 5.31%, and the DSP Small Cap Fund as the largest public shareholder at 9.02%. Individual investors collectively hold 18.68% of the shares.

The top shareholders of Lumax Auto Tech include several key players. The majority shareholders are the promoters, with Deepak Jain being the promoter with the highest holding at 18.96%. Additionally, mutual funds hold a significant stake through five schemes, accounting for 13.71% of the shares. Foreign Institutional Investors (FIIs) have a combined holding of 5.31% across 53 FIIs. The highest public shareholder is the DSP Small Cap Fund, which holds 9.02%. Individual investors also have a notable presence, holding 18.68% of the shares.

View full answer

Has Lumax Auto Tech. declared dividend?

06-Jun-2025

Yes, Lumax Auto Technologies Ltd has declared a 275% dividend, amounting to ₹5.5 per share, with an ex-date of September 9, 2024. The company has shown significant total returns across various periods, highlighting its commitment to shareholder value.

Lumax Auto Technologies Ltd has declared a 275% dividend.<BR><BR>Dividend Details:<BR>- Percentage announced: 275%<BR>- Amount per share: 5.5<BR>- Ex-date: 09 Sep 2024<BR><BR>Dividend Yield: 0.56%.<BR><BR>Total Returns by Period:<BR>In the 6-month period, the price return was 74.85%, with no dividend return, resulting in a total return of 74.85%.<BR><BR>For the 1-year period, the price return was 98.4%, with a dividend return of 1.10%, leading to a total return of 99.5%.<BR><BR>Over the 2-year period, the price return was 175.29%, with a dividend return of 2.86%, culminating in a total return of 178.15%.<BR><BR>In the 3-year period, the price return was 448.64%, with a dividend return of 8.69%, resulting in a total return of 457.33%.<BR><BR>For the 4-year period, the price return was 554.08%, with a dividend return of 10.85%, giving a total return of 564.93%.<BR><BR>Over the 5-year period, the price return was 1151.61%, with a dividend return of 19.43%, leading to a total return of 1171.04%.<BR><BR>Overall, Lumax Auto Technologies Ltd has shown significant growth in total returns across all periods, with the recent dividend declaration indicating a strong commitment to returning value to shareholders. The dividend yield, although modest, complements the impressive price returns.

View full answer
iScoreScore
Click here to find our call on this stock
Strong Sell
Sell
Hold
Buy
Strong Buy

Dashboard

1

High Management Efficiency with a high ROCE of 20.01%

 
2

Strong ability to service debt as the company has a low Debt to EBITDA ratio of 1.87 times

 
3

Healthy long term growth as Net Sales has grown by an annual rate of 32.04% and Operating profit at 42.25%

 
4

The company has declared Positive results for the last 8 consecutive quarters

5

High Institutional Holdings at 25.22%

6

Consistent Returns over the last 3 years

stock-summaryMojo Parameters

Mojo Parameters

Loading Valuation Snapshot...

Stock DNA

stock-summary
Industry

Auto Components & Equipments

stock-summary
Market cap

INR 13,215 Cr (Small Cap)

stock-summary
P/E

40.00

stock-summary
Industry P/E

40

stock-summary
Dividend Yield

0.28%

stock-summary
Debt Equity

0.73

stock-summary
Return on Equity

24.25%

stock-summary
Price to Book

11.16

Revenue and Profits:
Net Sales:
1,364 Cr
(Quarterly Results - Jun 2026)
Net Profit:
87 Cr
stock-summaryTotal Returns
Total Returns (Price + Dividend) stock-summary
Dividend Yield (0.28%)
TimePeriod
Price Return
Dividend Return
Total Return
3 Months
20.23%
0.34%
20.57%
6 Months
28.81%
0.38%
29.19%
1 Year
73.94%
0.50%
74.44%
2 Years
275.83%
1.94%
277.77%
3 Years
418.7%
4.62%
423.32%
4 Years
586.46%
7.73%
594.19%
5 Years
1308.06%
17.76%
1325.82%

Latest dividend: 5.5 per share ex-dividend date: Aug-06-2026

Risk Adjusted Returns v/s stock-summary
Returns Beta
Icon
Beta has not been calculated since enough price history is not available
stock-summaryNews & Corporate Actions

News

Lumax Auto Technologies Ltd Falls 1.52%: 5 Key Factors Driving the Weekly Move

Announcements stock-summary

Shareholder Meeting / Postal Ballot-Outcome of AGM

26-Aug-2026 | Source : BSE

Proceedings of the 45th Annual General Meeting of the Company held on August 26 2026

Shareholder Meeting / Postal Ballot-Scrutinizers Report

26-Aug-2026 | Source : BSE

Submission of Voting Results as per Regulation 44 of SEBI (Listing Obligations and Disclosure Requirements) Regulations 2015 along with Scrutinizers Report on 45th Annual General Meeting of the Company.

Announcement under Regulation 30 (LODR)-Earnings Call Transcript

18-Aug-2026 | Source : BSE

Transcript of Earnings Conference Call held on Tuesday August 11 2026.

Corporate Actions stock-summary

stock-summary
BOARD MEETING

No Upcoming Board Meetings

stock-summary
DIVIDEND

Lumax Auto Technologies Ltd has declared 275% dividend, ex-date: 06 Aug 26

stock-summary
SPLITS

Lumax Auto Technologies Ltd has announced 2:10 stock split, ex-date: 07 Jun 18

stock-summary
BONUS

No Bonus history available

stock-summary
RIGHTS

No Rights history available

stock-summaryKey Factors

Quality key factors stock-summary

Factor
Value
Sales Growth (5y)
32.04%
EBIT Growth (5y)
42.25%
EBIT to Interest (avg)
6.53
Debt to EBITDA (avg)
1.90
Net Debt to Equity (avg)
0.73
Sales to Capital Employed (avg)
1.90
Tax Ratio
17.67%
Dividend Payout Ratio
21.09%
Pledged Shares
0
Institutional Holding
25.22%
ROCE (avg)
20.53%
ROE (avg)
17.58%

Valuation key factors

Factor
Value
P/E Ratio
40
Industry P/E
40
Price to Book Value
11.16
EV to EBIT
26.92
EV to EBITDA
19.88
EV to Capital Employed
6.87
EV to Sales
2.76
PEG Ratio
0.49
Dividend Yield
0.28%
ROCE (Latest)
22.88%
ROE (Latest)
24.25%

Technicals key factors

Indicator
Weekly
Monthly
MACD
Bullish
Bullish
RSI
Bearish
No Signal
Bollinger Bands
Bullish
Mildly Bullish
Moving Averages
Bullish (Daily)
KST
Bullish
Mildly Bearish
Dow Theory
Bullish
Bullish
OBV
Mildly Bearish
No Trend
stock-summary Technical Indicator Scale: Bearish, Mildly Bearish, Sideways, Mildly Bullish, Bullish  Turned 
stock-summaryShareholding
Shareholding Snapshot : Jun 2026stock-summary
Shareholding Compare (%holding) stock-summary
Majority shareholders

Promoters

Pledged Promoter Holdings

None

Mutual Funds

Held by 16 Schemes (13.15%)

FIIs

Held by 132 FIIs (8.69%)

Promoter with highest holding

Deepak Jain (18.96%)

Highest Public shareholder

Dsp Small Cap Fund (7.83%)

Individual Investors Holdings

15.58%

stock-summaryFinancial
[
  {
    "link": "quarterly",
    "btn_text": "All Quarterly Results",
    "header": "Quarterly Results Snapshot (Consolidated) - Jun'26 - QoQ",
    "rhs": [
      {
        "prefix": "Net Sales ",
        "suffix": "QoQ Growth in quarter ended Jun 2026 is -3.76% vs 11.51% in Mar 2026",
        "dir": -1
      },
      {
        "prefix": "Consolidated Net Profit ",
        "suffix": "QoQ Growth in quarter ended Jun 2026 is -1.68% vs 6.85% in Mar 2026",
        "dir": -1
      }
    ],
    "table": {
      "header": [
        "Jun'26",
        "Mar'26",
        "Change(%)"
      ],
      "body": [
        {
          "field": "Net Sales",
          "val1": "1,363.62",
          "val2": "1,416.93",
          "chgp": "-3.76%",
          "chgp_class": "negative"
        },
        {
          "field": "Operating Profit (PBDIT) excl Other Income",
          "val1": "190.20",
          "val2": "203.21",
          "chgp": "-6.40%",
          "chgp_class": "negative"
        },
        {
          "field": "Interest",
          "val1": "24.71",
          "val2": "30.57",
          "chgp": "-19.17%",
          "chgp_class": "positive"
        },
        {
          "field": "Exceptional Items",
          "val1": "0.00",
          "val2": "0.45",
          "chgp": "-100.00%",
          "chgp_class": "negative"
        },
        {
          "field": "Consolidate Net Profit",
          "val1": "86.64",
          "val2": "88.12",
          "chgp": "-1.68%",
          "chgp_class": "negative"
        },
        {
          "field": "Operating Profit Margin (Excl OI)",
          "val1": "13.95%",
          "val2": "14.34%",
          "chgp": "-0.39%",
          "chgp_class": "negative"
        }
      ]
    }
  },
  {
    "link": "half-yearly",
    "btn_text": "All Half Yearly Results",
    "header": "Half Yearly Results Snapshot (Consolidated) - Sep'25",
    "rhs": [
      {
        "prefix": "Net Sales ",
        "suffix": " Growth in half year ended Sep 2025 is 36.58% vs 20.00% in Sep 2024",
        "dir": 1
      },
      {
        "prefix": "Consolidated Net Profit ",
        "suffix": " Growth in half year ended Sep 2025 is 45.19% vs 50.52% in Sep 2024",
        "dir": -1
      }
    ],
    "table": {
      "header": [
        "Sep'25",
        "Sep'24",
        "Change(%)"
      ],
      "body": [
        {
          "field": "Net Sales",
          "val1": "2,182.74",
          "val2": "1,598.19",
          "chgp": "36.58%",
          "chgp_class": "positive"
        },
        {
          "field": "Operating Profit (PBDIT) excl Other Income",
          "val1": "279.40",
          "val2": "190.24",
          "chgp": "46.87%",
          "chgp_class": "positive"
        },
        {
          "field": "Interest",
          "val1": "47.56",
          "val2": "37.98",
          "chgp": "25.22%",
          "chgp_class": "negative"
        },
        {
          "field": "Exceptional Items",
          "val1": "0.00",
          "val2": "0.00",
          "chgp": "",
          "chgp_class": "neutral"
        },
        {
          "field": "Consolidate Net Profit",
          "val1": "108.27",
          "val2": "74.57",
          "chgp": "45.19%",
          "chgp_class": "positive"
        },
        {
          "field": "Operating Profit Margin (Excl OI)",
          "val1": "12.80%",
          "val2": "11.90%",
          "chgp": "0.90%",
          "chgp_class": "positive"
        }
      ]
    }
  },
  {
    "link": "nine-monthly",
    "btn_text": "All Nine Monthly Results",
    "header": "Nine Monthly Results Snapshot (Consolidated) - Dec'25",
    "rhs": [
      {
        "prefix": "Net Sales ",
        "suffix": "YoY Growth in nine months ended Dec 2025 is 37.93% vs 21.29% in Dec 2024",
        "dir": 1
      },
      {
        "prefix": "Consolidated Net Profit ",
        "suffix": "YoY Growth in nine months ended Dec 2025 is 59.76% vs 38.86% in Dec 2024",
        "dir": 1
      }
    ],
    "table": {
      "header": [
        "Dec'25",
        "Dec'24",
        "Change(%)"
      ],
      "body": [
        {
          "field": "Net Sales",
          "val1": "3,453.40",
          "val2": "2,503.79",
          "chgp": "37.93%",
          "chgp_class": "positive"
        },
        {
          "field": "Operating Profit (PBDIT) excl Other Income",
          "val1": "455.29",
          "val2": "308.14",
          "chgp": "47.75%",
          "chgp_class": "positive"
        },
        {
          "field": "Interest",
          "val1": "74.87",
          "val2": "57.82",
          "chgp": "29.49%",
          "chgp_class": "negative"
        },
        {
          "field": "Exceptional Items",
          "val1": "-14.95",
          "val2": "0.00",
          "chgp": "",
          "chgp_class": "neutral"
        },
        {
          "field": "Consolidate Net Profit",
          "val1": "190.74",
          "val2": "119.39",
          "chgp": "59.76%",
          "chgp_class": "positive"
        },
        {
          "field": "Operating Profit Margin (Excl OI)",
          "val1": "13.18%",
          "val2": "12.31%",
          "chgp": "0.87%",
          "chgp_class": "positive"
        }
      ]
    }
  },
  {
    "link": "annual",
    "btn_text": "All Annual Results",
    "header": "Annual Results Snapshot (Consolidated) - Mar'26",
    "rhs": [
      {
        "prefix": "Net Sales ",
        "suffix": "YoY Growth in year ended Mar 2026 is 33.92% vs 28.88% in Mar 2025",
        "dir": 1
      },
      {
        "prefix": "Consolidated Net Profit ",
        "suffix": "YoY Growth in year ended Mar 2026 is 56.87% vs 36.56% in Mar 2025",
        "dir": 1
      }
    ],
    "table": {
      "header": [
        "Mar'26",
        "Mar'25",
        "Change(%)"
      ],
      "body": [
        {
          "field": "Net Sales",
          "val1": "4,870.33",
          "val2": "3,636.67",
          "chgp": "33.92%",
          "chgp_class": "positive"
        },
        {
          "field": "Operating Profit (PBDIT) excl Other Income",
          "val1": "658.50",
          "val2": "464.77",
          "chgp": "41.68%",
          "chgp_class": "positive"
        },
        {
          "field": "Interest",
          "val1": "105.45",
          "val2": "79.01",
          "chgp": "33.46%",
          "chgp_class": "negative"
        },
        {
          "field": "Exceptional Items",
          "val1": "-14.50",
          "val2": "0.00",
          "chgp": "",
          "chgp_class": "neutral"
        },
        {
          "field": "Consolidate Net Profit",
          "val1": "278.86",
          "val2": "177.77",
          "chgp": "56.87%",
          "chgp_class": "positive"
        },
        {
          "field": "Operating Profit Margin (Excl OI)",
          "val1": "13.52%",
          "val2": "12.78%",
          "chgp": "0.74%",
          "chgp_class": "positive"
        }
      ]
    }
  }
]

Quarterly Results Snapshot (Consolidated) - Jun'26 - QoQstock-summary

Jun'26
Mar'26
Change(%)
Net Sales
1,363.62
1,416.93
-3.76%
Operating Profit (PBDIT) excl Other Income
190.20
203.21
-6.40%
Interest
24.71
30.57
-19.17%
Exceptional Items
0.00
0.45
-100.00%
Consolidate Net Profit
86.64
88.12
-1.68%
Operating Profit Margin (Excl OI)
13.95%
14.34%
-0.39%
Values in Rs Cr.
Direction Arrows
Net Sales

QoQ Growth in quarter ended Jun 2026 is -3.76% vs 11.51% in Mar 2026

Direction Arrows
Consolidated Net Profit

QoQ Growth in quarter ended Jun 2026 is -1.68% vs 6.85% in Mar 2026

Half Yearly Results Snapshot (Consolidated) - Sep'25stock-summary

Sep'25
Sep'24
Change(%)
Net Sales
2,182.74
1,598.19
36.58%
Operating Profit (PBDIT) excl Other Income
279.40
190.24
46.87%
Interest
47.56
37.98
25.22%
Exceptional Items
0.00
0.00
Consolidate Net Profit
108.27
74.57
45.19%
Operating Profit Margin (Excl OI)
12.80%
11.90%
0.90%
Values in Rs Cr.
Direction Arrows
Net Sales

Growth in half year ended Sep 2025 is 36.58% vs 20.00% in Sep 2024

Direction Arrows
Consolidated Net Profit

Growth in half year ended Sep 2025 is 45.19% vs 50.52% in Sep 2024

Nine Monthly Results Snapshot (Consolidated) - Dec'25stock-summary

Dec'25
Dec'24
Change(%)
Net Sales
3,453.40
2,503.79
37.93%
Operating Profit (PBDIT) excl Other Income
455.29
308.14
47.75%
Interest
74.87
57.82
29.49%
Exceptional Items
-14.95
0.00
Consolidate Net Profit
190.74
119.39
59.76%
Operating Profit Margin (Excl OI)
13.18%
12.31%
0.87%
Values in Rs Cr.
Direction Arrows
Net Sales

YoY Growth in nine months ended Dec 2025 is 37.93% vs 21.29% in Dec 2024

Direction Arrows
Consolidated Net Profit

YoY Growth in nine months ended Dec 2025 is 59.76% vs 38.86% in Dec 2024

Annual Results Snapshot (Consolidated) - Mar'26stock-summary

Mar'26
Mar'25
Change(%)
Net Sales
4,870.33
3,636.67
33.92%
Operating Profit (PBDIT) excl Other Income
658.50
464.77
41.68%
Interest
105.45
79.01
33.46%
Exceptional Items
-14.50
0.00
Consolidate Net Profit
278.86
177.77
56.87%
Operating Profit Margin (Excl OI)
13.52%
12.78%
0.74%
Values in Rs Cr.
Direction Arrows
Net Sales

YoY Growth in year ended Mar 2026 is 33.92% vs 28.88% in Mar 2025

Direction Arrows
Consolidated Net Profit

YoY Growth in year ended Mar 2026 is 56.87% vs 36.56% in Mar 2025

stock-summaryCompany CV
About Lumax Auto Technologies Ltd stock-summary
stock-summary
Lumax Auto Technologies Ltd
Small Cap
Auto Components & Equipments
Lumax Auto Technologies Ltd was incorporated on October 30, 1981 as a private limited company with the Lumax Auto-Electricals Pvt Ltd. On November 2, 1988, the Company changed their name from Lumax Auto-Electricals Pvt Ltd to Dhanesh Auto Electricals Pvt Ltd. Subsequently, on March 30, 2002, the company got converted into public limited company and the name was changed to Dhanesh Auto Electricals Ltd. and finally, the name changed from Dhanesh Auto Electricals Ltd to Lumax Auto Technologies Ltd.
Company Coordinates stock-summary
Company Details
Plot No 70 Sector No 10, PCNTDA Bhosari Industrial Area Pune Maharashtra : 411026
stock-summary
Tel: 91-20-66304606/66304617
stock-summary
shares@lumaxautotech.com
Registrar Details
Bigshare Services Pvt Ltd , E-2 , Ansa Industrial Estate, Saki Vihar Road, Saki Naka, Andheri (E), Mumbai