
Compare Magellanic Cloud with Similar Stocks
Stock DNA
Computers - Software & Consulting
INR 1,338 Cr (Small Cap)
11.00
20
0.09%
0.34
16.85%
1.93
Total Returns (Price + Dividend) 
Latest dividend: 0.02 per share ex-dividend date: Sep-12-2025
Risk Adjusted Returns v/s
Returns Beta

News
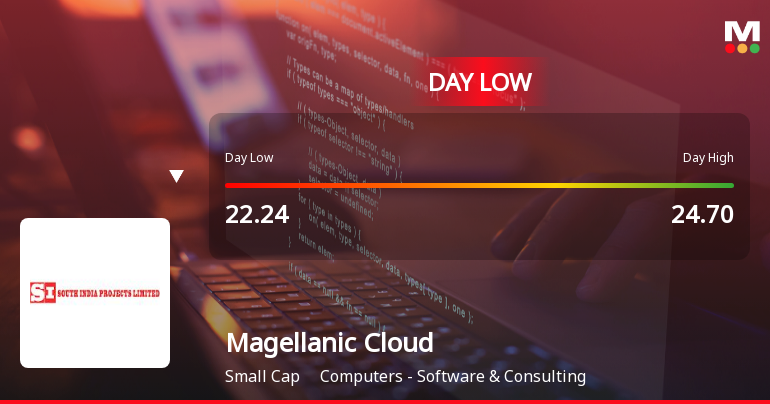
Magellanic Cloud Ltd Hits Intraday Low Amidst Price Pressure
Magellanic Cloud Ltd experienced a significant intraday decline on 11 Jun 2026, touching a low of Rs 22.6, down 7.11% from the previous close. The stock underperformed its sector and broader market indices amid sustained selling pressure and a challenging market environment.
Read full news article
Magellanic Cloud Ltd Downgraded to Sell Amid Technical Weakness and Promoter Risks
Magellanic Cloud Ltd, a small-cap player in the Computers - Software & Consulting sector, has seen its investment rating downgraded from Hold to Sell as of 8 June 2026. This shift reflects a combination of deteriorating technical indicators, valuation concerns, and disappointing recent market performance despite some positive financial trends. The company’s Mojo Score now stands at 46.0, signalling caution for investors amid a challenging market environment.
Read full news article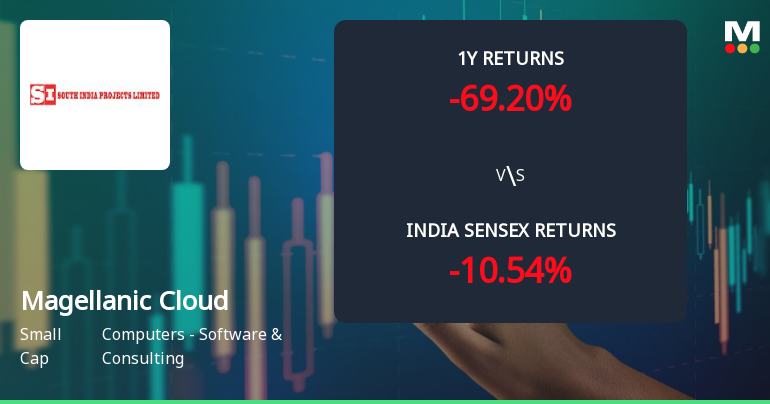
Magellanic Cloud Ltd Faces Bearish Momentum Amid Technical Downgrade
Magellanic Cloud Ltd, a small-cap player in the Computers - Software & Consulting sector, has experienced a notable shift in its technical momentum, prompting a downgrade from Hold to Sell by MarketsMOJO. The stock’s recent price action and technical indicators suggest increasing bearish pressure, with key metrics signalling caution for investors amid a challenging market backdrop.
Read full news article Announcements
Announcement under Regulation 30 (LODR)-Change in Management
04-Jun-2026 | Source : BSEAttached Herewith the Regulation 30 SEBI LODR Regulation 2015 for Resignation of Director
Announcement under Regulation 30 (LODR)-Resignation of Director
04-Jun-2026 | Source : BSEAttached herewith the disclosure under Regulation 30 of SEBI (LODR) Regulations 2015 for Resignation of Director
Announcement under Regulation 30 (LODR)-Resignation of Director
04-Jun-2026 | Source : BSEAttached herewith disclosure under Regulation 30 of SEBI (LODR) Regulations 2015 pertaining to resignation of Director
Corporate Actions

No Upcoming Board Meetings

Magellanic Cloud Ltd has declared 1% dividend, ex-date: 12 Sep 25

Magellanic Cloud Ltd has announced 2:10 stock split, ex-date: 26 Jul 24

Magellanic Cloud Ltd has announced 3:1 bonus issue, ex-date: 21 Mar 23

No Rights history available
Quality key factors
Valuation key factors
Technicals key factors
 Technical Indicator Scale: Bearish, Mildly Bearish, Sideways, Mildly Bullish, Bullish Turned
 Shareholding Snapshot : Mar 2026
Shareholding Compare (%holding)
Promoters
33.8807
Held by 1 Schemes (0.0%)
Held by 12 FIIs (0.23%)
Joseph Sudheer Reddy Thumma (35.9%)
Venkatesan Ramasamy (4.34%)
35.03%
Quarterly Results Snapshot (Consolidated) - Mar'26 - YoY

YoY Growth in quarter ended Mar 2026 is 31.47% vs 13.95% in Mar 2025
YoY Growth in quarter ended Mar 2026 is 32.06% vs -42.63% in Mar 2025
Half Yearly Results Snapshot (Consolidated) - Sep'25
Growth in half year ended Sep 2025 is 13.45% vs -0.81% in Sep 2024

Growth in half year ended Sep 2025 is 9.37% vs 22.72% in Sep 2024
Nine Monthly Results Snapshot (Consolidated) - Dec'25
YoY Growth in nine months ended Dec 2025 is 11.67% vs 4.18% in Dec 2024
YoY Growth in nine months ended Dec 2025 is 5.73% vs 24.90% in Dec 2024
Annual Results Snapshot (Consolidated) - Mar'26
YoY Growth in year ended Mar 2026 is 16.85% vs 6.57% in Mar 2025
YoY Growth in year ended Mar 2026 is 11.24% vs -0.12% in Mar 2025
About Magellanic Cloud Ltd

Company Coordinates


