
Compare Mah. Corporation with Similar Stocks
Total Returns (Price + Dividend) 
Mah. Corporation for the last several years.
Risk Adjusted Returns v/s
Returns Beta

News
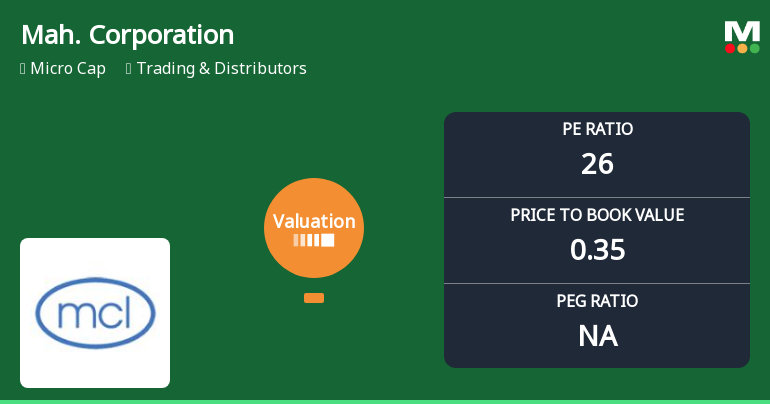
Maharashtra Corporation Ltd Valuation Shifts Signal Elevated Risk Amid Weak Returns
Maharashtra Corporation Ltd, a micro-cap player in the Trading & Distributors sector, has seen a marked deterioration in its valuation metrics, shifting from a previously very expensive rating to a risky classification. This change reflects growing concerns over the company’s financial health and market performance, underscored by weak returns and unfavourable price multiples compared to peers and historical averages.
Read full news articleWhen is the next results date for Maharashtra Corporation Ltd?
The next results date for Maharashtra Corporation Ltd is scheduled for 29 May 2026....
Read full news article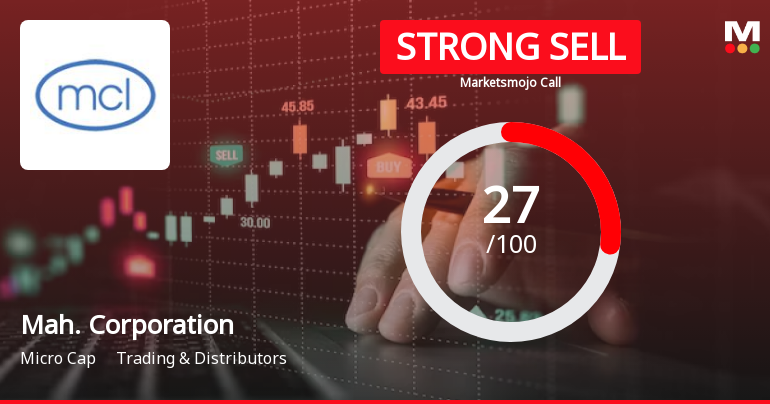
Maharashtra Corporation Ltd is Rated Strong Sell
Maharashtra Corporation Ltd is rated Strong Sell by MarketsMOJO, with this rating last updated on 29 May 2025. However, the analysis and financial metrics discussed here reflect the company’s current position as of 21 May 2026, providing investors with an up-to-date perspective on the stock’s fundamentals, valuation, financial trends, and technical outlook.
Read full news article Announcements
Announcement under Regulation 30 (LODR)-Newspaper Publication
01-Jun-2026 | Source : BSENewspaper Publication
Compliances-Reg.24(A)-Annual Secretarial Compliance
30-May-2026 | Source : BSEAnnual Secretarial Compliance Report as per Reg. 24(A)
Audited Financial Result For The Quarter And Year Ended March 31 2026
29-May-2026 | Source : BSEAudited Financial Result for the quarter and year ended March 31 2026
Corporate Actions

No Upcoming Board Meetings

No Dividend history available

Maharashtra Corporation Ltd has announced 1:10 stock split, ex-date: 25 Sep 14

Maharashtra Corporation Ltd has announced 5:3 bonus issue, ex-date: 03 Nov 06

Maharashtra Corporation Ltd has announced 11:3 rights issue, ex-date: 08 Jul 22
Quality key factors
Valuation key factors
Technicals key factors
 Technical Indicator Scale: Bearish, Mildly Bearish, Sideways, Mildly Bullish, Bullish Turned
 Shareholding Snapshot : Mar 2026
Shareholding Compare (%holding)
Non Institution
None
Held by 0 Schemes
Held by 0 FIIs
Sagar Portfolio Services Limited (9.82%)
Epiphany Sales Private Limited (6.44%)
70.96%
Quarterly Results Snapshot (Standalone) - Mar'26 - QoQ

QoQ Growth in quarter ended Mar 2026 is 0.00% vs -100.00% in Dec 2025
QoQ Growth in quarter ended Mar 2026 is 50.00% vs -300.00% in Dec 2025
Half Yearly Results Snapshot (Standalone) - Sep'25

Growth in half year ended Sep 2025 is -94.44% vs 0.00% in Sep 2024
Growth in half year ended Sep 2025 is -171.11% vs 250.00% in Sep 2024
Nine Monthly Results Snapshot (Standalone) - Dec'25
YoY Growth in nine months ended Dec 2025 is -96.77% vs 181.82% in Dec 2024
YoY Growth in nine months ended Dec 2025 is -142.35% vs 347.37% in Dec 2024
Annual Results Snapshot (Standalone) - Mar'26
YoY Growth in year ended Mar 2026 is -96.77% vs 98.72% in Mar 2025
YoY Growth in year ended Mar 2026 is -511.11% vs -62.50% in Mar 2025
About Maharashtra Corporation Ltd

Company Coordinates


