
Compare Manaksia Coated with Similar Stocks
Dashboard
Low ability to service debt as the company has a high Debt to EBITDA ratio of 1.43 times
- Low ability to service debt as the company has a high Debt to EBITDA ratio of 1.43 times
- The company has been able to generate a Return on Equity (avg) of 7.58% signifying low profitability per unit of shareholders funds
Poor long term growth as Net Sales has grown by an annual rate of 10.81% over the last 5 years
Positive results in Jun 26
With ROCE of 16.5, it has a Attractive valuation with a 3.3 Enterprise value to Capital Employed
Falling Participation by Institutional Investors
Stock DNA
Iron & Steel Products
INR 1,331 Cr (Micro Cap)
32.00
36
0.04%
0.23
11.66%
3.79
Total Returns (Price + Dividend) 
Latest dividend: 0.05 per share ex-dividend date: Sep-09-2025
Risk Adjusted Returns v/s
Returns Beta

News
Are Manaksia Coated Metals & Industries Ltd latest results good or bad?
Manaksia Coated Metals & Industries Ltd reported its Q1 FY27 results, showcasing a notable quarter-on-quarter increase in net profit, which rose to ₹14.10 crores from ₹5.37 crores in the previous quarter, reflecting a substantial growth rate of 162.57%. This improvement was driven by a robust revenue growth of 15.25%, pushing net sales to an all-time quarterly high of ₹262.14 crores. The operating profit also saw a significant increase, with operating margins expanding to 10.74%, marking the highest level in eight quarters. However, while the headline figures indicate strong performance, there are underlying operational challenges that merit attention. The company's inventory turnover ratio has deteriorated to 2.61 times, suggesting slower conversion of inventory into sales, which could indicate potential working capital pressures. Additionally, the debtors turnover ratio weakened to 9.03 times, indicating...
Read full news article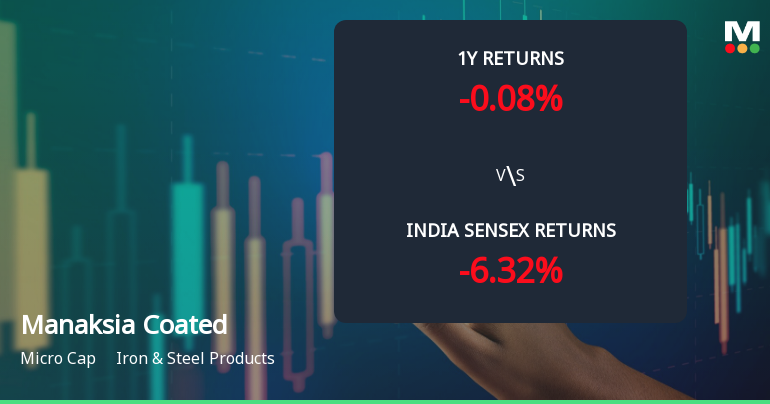
Manaksia Coated Metals & Industries Ltd Shows Technical Momentum Shift Amid Mixed Indicators
Manaksia Coated Metals & Industries Ltd has experienced a notable shift in its technical momentum, moving from a sideways trend to a mildly bullish stance. This change is reflected across several key technical indicators, signalling a cautiously optimistic outlook for the micro-cap iron and steel products company as it trades at ₹129.25, up 2.42% on 15 Jul 2026.
Read full news article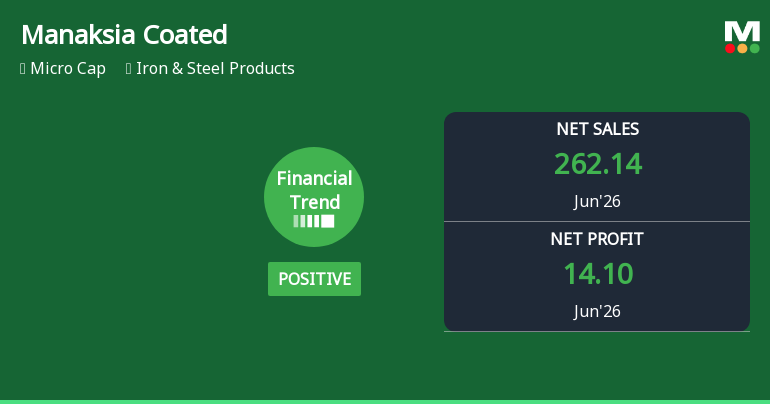
Manaksia Coated Metals & Industries Ltd Reports Strong Quarterly Upswing Amid Positive Financial Trend
Manaksia Coated Metals & Industries Ltd has demonstrated a marked improvement in its financial performance for the quarter ended June 2026, shifting from a flat to a positive financial trend. The company’s latest quarterly results reveal record highs in revenue, profitability, and liquidity metrics, signalling a potential turnaround for this micro-cap player in the iron and steel products sector.
Read full news article Announcements
Manaksia Coated Metals & Industries Limited - Other General Purpose
05-Dec-2019 | Source : NSEManaksia Coated Metals & Industries Limited has informed the Exchange regarding Compliance under Regulation 23(9) of SEBI Listing Regulations of Related Party transactions for the half year ended September 30, 2019.
Manaksia Coated Metals & Industries Limited - Shareholders meeting
26-Sep-2019 | Source : NSEManaksia Coated Metals & Industries Limited has submitted the Exchange a copy Srutinizers report of Annual General Meeting held on September 24, 2019. Further, the company has informed the Exchange regarding voting results.
Manaksia Coated Metals & Industries Limited - Shareholders meeting
25-Sep-2019 | Source : NSEManaksia Coated Metals & Industries Limited has informed the Exchange regarding Proceedings of Annual General Meeting held on September 24, 2019
Corporate Actions

No Upcoming Board Meetings

Manaksia Coated Metals & Industries Ltd has declared 5% dividend, ex-date: 09 Sep 25

No Splits history available

No Bonus history available

No Rights history available
Quality key factors
Valuation key factors
Technicals key factors
 Technical Indicator Scale: Bearish, Mildly Bearish, Sideways, Mildly Bullish, Bullish Turned
 Shareholding Snapshot : Jun 2026
Shareholding Compare (%holding)
Promoters
None
Held by 0 Schemes
Held by 4 FIIs (0.22%)
Sushil Kumar Agrawal (31.99%)
Elysian Wealth Fund (4.03%)
24.31%
Quarterly Results Snapshot (Consolidated) - Jun'26 - QoQ

QoQ Growth in quarter ended Jun 2026 is 15.25% vs 21.70% in Mar 2026

QoQ Growth in quarter ended Jun 2026 is 162.57% vs -26.94% in Mar 2026
Half Yearly Results Snapshot (Consolidated) - Sep'25
Growth in half year ended Sep 2025 is 27.51% vs 0.67% in Sep 2024
Growth in half year ended Sep 2025 is 422.80% vs 151.17% in Sep 2024
Nine Monthly Results Snapshot (Consolidated) - Dec'25
YoY Growth in nine months ended Dec 2025 is 14.52% vs 2.99% in Dec 2024
YoY Growth in nine months ended Dec 2025 is 240.93% vs 67.64% in Dec 2024
Annual Results Snapshot (Consolidated) - Mar'26
YoY Growth in year ended Mar 2026 is 13.16% vs 5.68% in Mar 2025
YoY Growth in year ended Mar 2026 is 164.39% vs 36.92% in Mar 2025
About Manaksia Coated Metals & Industries Ltd

Company Coordinates


