
Compare Manaksia with Similar Stocks
Stock DNA
Iron & Steel Products
INR 374 Cr (Micro Cap)
7.00
14
0.00%
-0.53
7.24%
0.52
Total Returns (Price + Dividend) 
Latest dividend: 3 per share ex-dividend date: Sep-14-2023
Risk Adjusted Returns v/s
Returns Beta

News

Manaksia Ltd Upgraded to Hold as Financial and Valuation Metrics Improve
Manaksia Ltd, a micro-cap player in the Iron & Steel Products sector, has seen its investment rating upgraded from Sell to Hold as of 2 June 2026. This revision reflects a nuanced improvement across four critical parameters: financial trend, valuation, technical indicators, and overall quality. Despite some lingering challenges, the company’s recent quarterly performance and valuation metrics have prompted a more cautious but optimistic stance among analysts.
Read full news article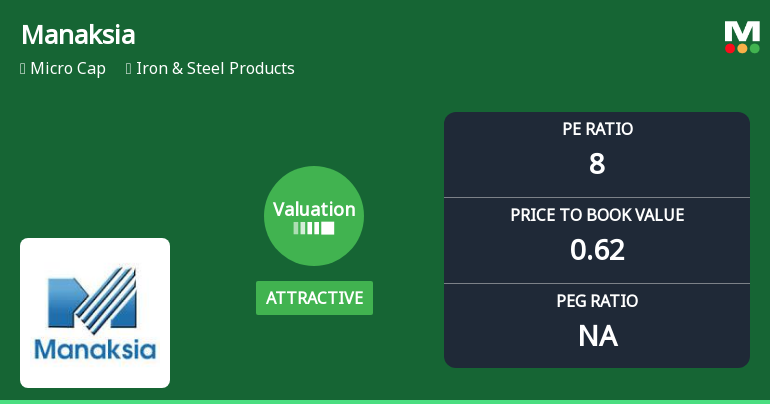
Manaksia Ltd Valuation Turns Attractive Amid Market Volatility
Manaksia Ltd, a micro-cap player in the Iron & Steel Products sector, has seen a notable shift in its valuation parameters, moving from fair to attractive territory. Despite recent share price weakness and sector headwinds, the company’s price-to-earnings (P/E) and price-to-book value (P/BV) ratios now present a compelling case for investors seeking value in a challenging market environment.
Read full news article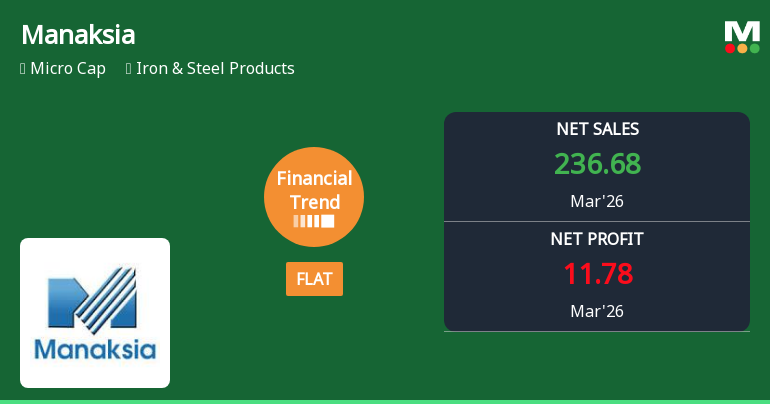
Manaksia Ltd Reports Mixed Quarterly Results Amid Shifting Financial Trends
Manaksia Ltd, a micro-cap player in the Iron & Steel Products sector, has posted a mixed set of results for the quarter ended March 2026. While the company achieved its highest quarterly operating profit margin and PBDIT in recent history, net profit after tax (PAT) declined by 12.4% compared to the previous four-quarter average, signalling emerging challenges despite operational improvements.
Read full news article Announcements
Announcement under Regulation 30 (LODR)-Newspaper Publication
30-May-2026 | Source : BSENewspaper Publication of Financial Results for the quarte and year ended 31st March 2026
Board Meeting Outcome for Outcome Of Board Meeting Held On 29Th May 2026
29-May-2026 | Source : BSEThe Board of Directors of the Company at its meeting held today i.e. 29th May 2026 which commenced at 04:00 P.M. and concluded at 05:30 P.M. have inter alia transacted the following business(es): (a) Adopted the Audited Financial Statements (both Standalone and Consolidated) of the Company for the financial year ended on 31st March 2026. (b) Approved the Audited Financial Results (both Standalone and Consolidated) of the Company for the quarter and year ended on 31st March 2026. (c) Approved re-appointment of Agrawal Tondon & Co. (FRN: 329088E) as Internal Auditor of the Company for the Financial Year 2026-27. (d) Based on the recommendation of the Nomination and Remuneration Committee and approval of the Audit Committee the Board approved the re-appointment of Mr. Suresh Kumar Agrawal (DIN: 00520769) as Managing Director of the Company for a further period of three years w.e.f. 23rd November 2026 subject to the approval of the shareholders.
Audited Financial Results For The Quarter And Year Ended 31St March 2026
29-May-2026 | Source : BSEAudited Financial Results for the quarter and year ended 31st March 2026
Corporate Actions

No Upcoming Board Meetings

Manaksia Ltd has declared 150% dividend, ex-date: 14 Sep 23

No Splits history available

No Bonus history available

No Rights history available
Quality key factors
Valuation key factors
Technicals key factors
 Technical Indicator Scale: Bearish, Mildly Bearish, Sideways, Mildly Bullish, Bullish Turned
 Shareholding Snapshot : Mar 2026
Shareholding Compare (%holding)
Promoters
None
Held by 0 Schemes
Held by 14 FIIs (0.98%)
Varun Agrawal (18.88%)
Thermo Capital Private Limited (1.22%)
18.07%
Quarterly Results Snapshot (Consolidated) - Mar'26 - QoQ

QoQ Growth in quarter ended Mar 2026 is 28.62% vs -3.14% in Dec 2025

QoQ Growth in quarter ended Mar 2026 is -19.09% vs 32.48% in Dec 2025
Half Yearly Results Snapshot (Consolidated) - Sep'25
Growth in half year ended Sep 2025 is 32.33% vs -36.81% in Sep 2024
Growth in half year ended Sep 2025 is -17.90% vs -29.75% in Sep 2024
Nine Monthly Results Snapshot (Consolidated) - Dec'25
YoY Growth in nine months ended Dec 2025 is 18.36% vs -21.20% in Dec 2024
YoY Growth in nine months ended Dec 2025 is -8.79% vs -27.54% in Dec 2024
Annual Results Snapshot (Consolidated) - Mar'26
YoY Growth in year ended Mar 2026 is 7.26% vs 4.21% in Mar 2025
YoY Growth in year ended Mar 2026 is -6.50% vs -25.90% in Mar 2025
About Manaksia Ltd

Company Coordinates


