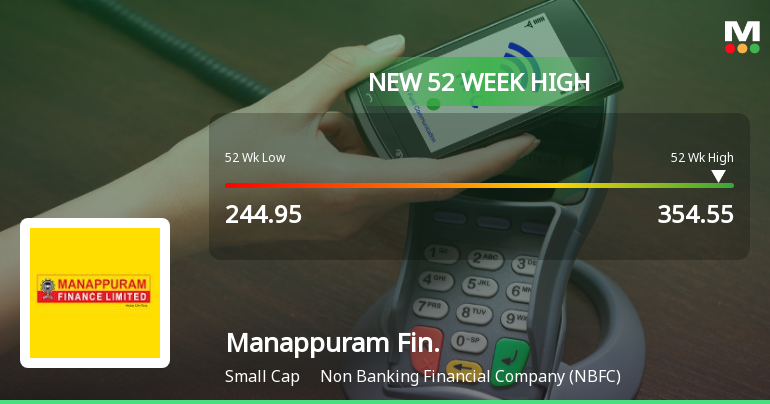
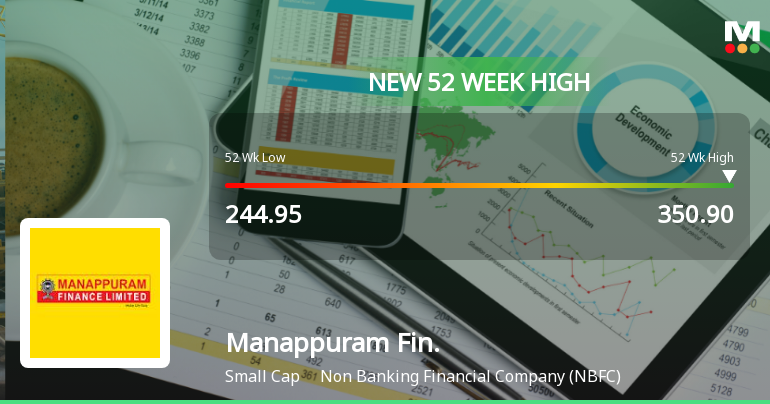
Manappuram Fin.

  • Market Cap: Small Cap
  • Industry: Non Banking Financial Company (NBFC)
  • ISIN: INE522D01027
  • NSEID: MANAPPURAM
  • BSEID: 531213
INR
330.50
10.2 (3.18%)
BSENSE

Sep 10, 03:30 PM

BSE+NSE Vol: 71.96 lacs

  • Price Points
  • Score
  • Mojo Parameters
  • Total Return
  • News and Corporate Actions
  • Key factors
  • Shareholding
  • Financials
  • CompanyCV
stock-summaryPrice Point
High/Low

1Day

52 Week

Valuation
Technical
Day's Volume

CASH

71.96 lacs (27.23%) Volume

Shareholding (Jun 2026)

FII

22.30%

Held by 184 FIIs

DII

14.84%

Held by 62 DIIs

Promoter

41.66%

Why is Manappuram Finance Ltd falling/rising?

06-Sep-2026

As of 05-Sep, Manappuram Finance Ltd's stock price is rising to 339.30, driven by strong investor interest and positive financial results, including significant growth in net profit and high institutional holdings. The stock has outperformed benchmark indices, indicating a favorable outlook despite some long-term growth concerns.

As of 05-Sep, Manappuram Finance Ltd's stock price is rising, currently at 339.30, reflecting a change of 3.0 (0.89%) upward. This increase can be attributed to several positive factors. The stock opened with a gain of 2.02% today and reached an intraday high of Rs 345.1, indicating strong investor interest. Additionally, the stock's performance today is described as inline with the sector, suggesting that it is maintaining competitiveness within its industry.<BR><BR>The company has demonstrated strong long-term fundamental strength, with an average Return on Equity (ROE) of 13.27% and a significant growth in net profit of 44.46%, as reported in their recent quarterly results. The positive financial results, including a 133.1% growth in Profit After Tax (PAT) and record high net sales, contribute to a favorable outlook for the stock. Furthermore, high institutional holdings at 37.15% indicate confidence from larger investors, who typically have more resources to analyze company fundamentals.<BR><BR>Despite some concerns regarding long-term growth rates in net sales and operating profit, the stock has outperformed the benchmark indices over various time frames, including a 19.45% return over the past year. This market-beating performance, combined with rising investor participation and liquidity, supports the upward movement in the stock price.

View full answer

Who are in the management team of Manappuram Fin.?

01-Sep-2026

The management team of Manappuram Finance includes V P Nandakumar (Managing Director & CEO), Shailesh J Mehta (Chairman), and several directors such as Manoj Kumar V R, Harshan Kollara, and Sumitha Jayasankar, along with independent directors like V R Ramachandran and P Manomohanan, bringing diverse expertise to the company.

The management team of Manappuram Finance includes the following key members:<BR><BR>1. **V P Nandakumar** - Managing Director & CEO<BR>2. **Shailesh J Mehta** - Chairman (Non-Executive)<BR>3. **Manoj Kumar V R** - Company Secretary & Compliance Officer<BR>4. **Harshan Kollara** - Director<BR>5. **Sekaripuram Ramanath Balasubramanian** - Director<BR>6. **Sumitha Jayasankar** - Whole-time Director<BR><BR>Additionally, the board includes several non-executive and independent directors:<BR><BR>1. **V R Ramachandran** - Non-Executive & Independent Director<BR>2. **P Manomohanan** - Non-Executive & Independent Director<BR>3. **Abhijit Sen** - Non-Executive & Independent Director<BR>4. **Pratima Ram** - Independent Director<BR>5. **V P Seemandini** - Independent Director<BR><BR>This team brings a diverse range of expertise and experience to the company.

View full answer

What does Manappuram Fin. do?

01-Sep-2026

Manappuram Finance Ltd is a diversified financial services provider in the NBFC sector, offering services such as gold loans and microfinance. As of June 2026, it reported net sales of ₹3,034 Cr and a net profit of ₹585 Cr, with a market cap of ₹31,853 Cr.

Overview:<BR>Manappuram Finance Ltd is a diversified financial services provider operating in the Non Banking Financial Company (NBFC) sector within the small-cap market.<BR><BR>History:<BR>The company was incorporated in 1992 as 'Manappuram General Finance and Leasing Limited' and later changed its name to Manappuram Finance Limited in 2011. The latest quarterly results reported net sales and profit for June 2026.<BR><BR>Financial Snapshot:<BR>- Net Sales: 3,034 Cr (Quarterly Results - Jun 2026)<BR>- Net Profit: 585 Cr (Quarterly Results - Jun 2026)<BR>- Market Cap: INR 31,853 Cr (Small Cap)<BR><BR>Key Metrics:<BR>- P/E: 22.00<BR>- Industry P/E: 21<BR>- Dividend Yield: 0.69%<BR>- Debt Equity: 3.60<BR>- Return on Equity: 6.25%<BR>- Price to Book: 2.05<BR><BR>Contact Details:<BR>Address: IV/470A (Old) W/638 (New), Manappuram House Valpad P O Thrissur Kerala : 680567<BR>Tel: 91-487-3050108/3050000/3050100<BR>Email: cosecretary@manappuram.com<BR>Website: http://www.manappuram.com

View full answer

Who are the peers of the Manappuram Fin.?

01-Sep-2026

Manappuram Fin.'s peers include HDB FINANC SER, M & M Fin. Serv., Sundaram Finance, and others. In terms of management risk, Manappuram Fin. is rated as good, with a 1-year return of 30.45%, lower than M & M Fin. Serv. at 47.21% but higher than HDB FINANC SER at -12.36%.

Peers: The peers of Manappuram Fin. are HDB FINANC SER, M & M Fin. Serv., Sundaram Finance, Authum Invest., Poonawalla Fin, Tata Inv.Corpn., Chola Financial, IIFL Finance, and Capri Global.<BR><BR>Quality Snapshot: Excellent management risk is observed at HDB FINANC SER, Sundaram Finance, and IIFL Finance, while Average management risk is found at M & M Fin. Serv., Authum Invest., Poonawalla Fin, Tata Inv.Corpn., Chola Financial, and Capri Global. Good management risk is noted for Manappuram Fin. Growth is Excellent at M & M Fin. Serv. and Capri Global, while Good growth is seen at Poonawalla Fin and IIFL Finance. Below Average growth is present at HDB FINANC SER, Authum Invest., and Manappuram Fin., with Average growth at Sundaram Finance, Tata Inv.Corpn., and Chola Financial.<BR><BR>Return Snapshot: The peer with the highest 1-year return is M & M Fin. Serv. at 47.21%, while the lowest is HDB FINANC SER at -12.36%. Manappuram Fin. has a 1-year return of 30.45%, which is significantly higher than HDB FINANC SER but lower than M & M Fin. Serv. Additionally, Sundaram Finance, Chola Financial, and HDB FINANC SER have negative six-month returns.

View full answer

How big is Manappuram Fin.?

01-Sep-2026

As of 31st August, Manappuram Finance Ltd has a market capitalization of 31,853.00 Cr, with recent net sales of 10,275.49 Cr and net profit of 1,449.48 Cr over the last four quarters.

As of 31st August, <BR><BR>Market Cap: Manappuram Finance Ltd has a market capitalization of 31,853.00 Cr, classifying it as a Small Cap company.<BR><BR>Recent Quarterly Performance: The sum of Net Sales for the latest 4 quarters is 10,275.49 Cr, while the sum of Net Profit for the same period is 1,449.48 Cr.<BR><BR>Balance Sheet Snapshot: The reporting period is March 2026, with Shareholder's Funds amounting to 16,050.74 Cr and Total Assets totaling 73,941.18 Cr.

View full answer

Should I buy, sell or hold Manappuram Finance Ltd?

13-Aug-2026

Has Manappuram Finance Ltd declared dividend?

13-Aug-2026

Yes, Manappuram Finance Ltd has declared a dividend of 50%, amounting to ₹0.5 per share, with an ex-date of May 11, 2026. The company has demonstrated strong total returns across various periods, with a total return of 36.69% over the past year.

Manappuram Finance Ltd has declared a dividend.<BR><BR>Dividend Details: <BR>Percentage announced: 50% <BR>Amount per share: 0.5 per share <BR>Ex-date: May-11-2026 <BR><BR>Dividend Yield: 0.52%. <BR><BR>Total Returns by Period: <BR>In the last 3 months, the price return was 12.13%, the dividend return was 0.33%, leading to a total return of 12.46%. <BR><BR>In the last 6 months, the price return was 14.76%, the dividend return was 0.49%, resulting in a total return of 15.25%. <BR><BR>Over the past year, the price return was 35.75%, with a dividend return of 0.94%, culminating in a total return of 36.69%. <BR><BR>In the last 2 years, the price return was 67.44%, the dividend return was 2.79%, which brought the total return to 70.23%. <BR><BR>For the last 3 years, the price return was 134.69%, the dividend return was 5.99%, leading to a total return of 140.68%. <BR><BR>In the last 4 years, the price return was 214.12%, with a dividend return of 10.50%, resulting in a total return of 224.62%. <BR><BR>Over the past 5 years, the price return was 109.47%, the dividend return was 8.45%, leading to a total return of 117.92%. <BR><BR>Overall, Manappuram Finance Ltd has declared a significant dividend and has shown strong total returns across various periods, indicating a positive performance for investors.

View full answer

When is the next results date for Manappuram Finance Ltd?

06-Aug-2026

The next results date for Manappuram Finance Ltd is 11 August 2026.

The next results date for Manappuram Finance Ltd is scheduled for 11 August 2026.

View full answer

Are Manappuram Finance Ltd latest results good or bad?

05-May-2026

Manappuram Finance Ltd's latest Q4 FY26 results are strong, with a net profit of ₹403.96 crores and revenue growth of 11.03%, marking a significant turnaround from a loss last year. However, concerns about a high debt-to-equity ratio and stretched valuation suggest caution for investors.

Manappuram Finance Ltd's latest results for Q4 FY26 indicate a strong performance overall. The company reported a net profit of ₹403.96 crores, which is a remarkable increase of 67.58% compared to the previous quarter. This turnaround is particularly significant given that the same quarter last year saw a net loss of ₹191.18 crores.<BR><BR>Revenue also saw a solid growth of 11.03% quarter-on-quarter, reaching ₹2,613.83 crores, marking the highest quarterly revenue in the company's recent history. The operating margin reached a record high of 66.44%, reflecting improved operational efficiency and favorable dynamics in the gold loan segment.<BR><BR>Despite the positive operational metrics, there are some concerns regarding the company's balance sheet, particularly its elevated debt-to-equity ratio of 3.60 times, which may limit flexibility in times of economic stress. Additionally, the valuation appears stretched with a P/E ratio of 63.31 times, significantly above the industry average.<BR><BR>In summary, while the operational results are strong and indicate a positive trend, the high valuation and leverage levels warrant caution for investors. Overall, the results can be seen as good, but they come with some risks that need to be monitored.

View full answer

Is Manappuram Fin. technically bullish or bearish?

02-Dec-2025

As of December 1, 2025, Manappuram Fin. shows a mildly bullish trend supported by daily moving averages, but caution is advised due to mixed signals from weekly and monthly indicators, including a bearish RSI.

As of 1 December 2025, the technical trend for Manappuram Fin. has changed from bullish to mildly bullish. The current stance is mildly bullish, supported by the daily moving averages indicating bullish momentum. However, the weekly MACD and KST are mildly bearish, which suggests some caution. The monthly MACD remains bullish, but the RSI on a monthly basis is bearish, indicating potential weakness. Bollinger Bands show a mildly bullish trend on both weekly and monthly time frames. Overall, the mixed signals across different indicators suggest a cautious bullish outlook with some underlying bearish pressures.

View full answer

How has been the historical performance of Manappuram Fin.?

30-Oct-2025

Manappuram Fin. has exhibited significant growth in net sales and profits, with total operating income rising from 4,179.51 Cr in Mar'19 to 10,007.68 Cr in Mar'25, despite some fluctuations in profit metrics. The company's total assets increased from 29,433.72 Cr in Mar'20 to 48,829.34 Cr in Mar'25, reflecting overall resilience and positive liquidity.

Answer:<BR>The historical performance of Manappuram Fin. shows a significant growth trajectory in net sales and profits over the years, with a notable increase in total operating income and net profit.<BR><BR>Breakdown:<BR>Manappuram Fin. has demonstrated a consistent upward trend in net sales, rising from 4,179.51 Cr in Mar'19 to 10,007.68 Cr in Mar'25. The total operating income followed a similar pattern, reaching 10,007.68 Cr in Mar'25, up from 4,179.51 Cr in Mar'19. Operating profit (PBDIT) peaked at 5,473.93 Cr in Mar'25, although it was lower than the previous year’s 6,071.59 Cr. Profit before tax also saw fluctuations, with a high of 2,959.51 Cr in Mar'24, but dropping to 1,665.64 Cr in Mar'25. The profit after tax mirrored this trend, decreasing from 2,197.48 Cr in Mar'24 to 1,203.88 Cr in Mar'25. Despite these fluctuations, the overall net profit remained strong at 1,216.15 Cr in Mar'25, compared to 940.46 Cr in Mar'19. The company’s total assets increased from 29,433.72 Cr in Mar'20 to 48,829.34 Cr in Mar'25, while total liabilities also rose, reflecting growth in short-term borrowings. Cash flow from operating activities showed improvement, with a net cash inflow of 540.00 Cr in Mar'25, indicating a positive shift in liquidity. Overall, Manappuram Fin. has shown resilience and growth in its financial performance over the years.

View full answer

Is Manappuram Fin. overvalued or undervalued?

13-Oct-2025

As of October 10, 2025, Manappuram Finance is considered very expensive and overvalued with a PE ratio of 30.16, elevated compared to peers like Bajaj Finance and Life Insurance, despite a strong stock performance of 50.95% over the year compared to the Sensex's 1.09%.

As of 10 October 2025, the valuation grade for Manappuram Finance has moved from expensive to very expensive, indicating a significant shift in its perceived market value. The company is currently considered overvalued. Key ratios include a PE ratio of 30.16, an EV to EBITDA of 11.68, and a Price to Book Value of 1.94, which are all elevated compared to industry norms.<BR><BR>In comparison to peers, Bajaj Finance has a PE ratio of 36.56, while Life Insurance shows a more attractive PE of 11.65, highlighting the relative overvaluation of Manappuram Finance. Additionally, the company's recent stock performance has outpaced the Sensex over the year, with a return of 50.95% compared to the Sensex's 1.09%, though this does not mitigate the current overvaluation.

View full answer

Who are the top shareholders of the Manappuram Fin.?

06-Jun-2025

The top shareholders of Manappuram Finance include Nandakumar V P with 29.05%, foreign institutional investors at 28.42%, and mutual funds holding 6.61%. Smallcap World Fund, Inc. is the largest public shareholder at 6.13%, while individual investors own 20.51% of the shares.

The top shareholders of Manappuram Finance include a mix of promoters and institutional investors. The largest promoter is Nandakumar V P, who holds 29.05% of the shares. In terms of institutional holdings, foreign institutional investors (FIIs) collectively own 28.42%, while mutual funds hold 6.61% across 29 schemes. The highest public shareholder is Smallcap World Fund, Inc, with a holding of 6.13%. Additionally, individual investors account for 20.51% of the shareholding.

View full answer

What is the bonus history of the Manappuram Fin.?

06-Jun-2025

Manappuram Finance has issued several bonuses to shareholders, including a 1:1 bonus on June 9, 2011, May 3, 2010, and March 14, 2007, demonstrating its commitment to rewarding investors.

Manappuram Finance has a history of issuing bonuses to its shareholders. The most recent bonus was a 1:1 issue announced with an ex-date of June 9, 2011, and a record date of June 10, 2011. Prior to that, the company also issued a 1:1 bonus on May 3, 2010, with a record date of May 4, 2010. Additionally, there was another 1:1 bonus issued on March 14, 2007, with a record date of March 15, 2007. This consistent pattern of issuing bonuses reflects the company's commitment to rewarding its shareholders.

View full answer
iScoreScore
Part of MojoOne Strategy
Click here to find our call on this stock
Strong Sell
Sell
Hold
Buy
Strong Buy

Dashboard

1

Strong Long Term Fundamental Strength with an average Return on Equity (ROE) of 13.27%

 
2

With a growth in Net Profit of 44.46%, the company declared Very Positive results in Jun 26

3

High Institutional Holdings at 37.15%

4

Consistent Returns over the last 3 years

stock-summaryMojo Parameters

Mojo Parameters

Loading Valuation Snapshot...

Stock DNA

stock-summary
Industry

Non Banking Financial Company (NBFC)

stock-summary
Market cap

INR 30,237 Cr (Small Cap)

stock-summary
P/E

21.00

stock-summary
Industry P/E

20

stock-summary
Dividend Yield

0.75%

stock-summary
Debt Equity

3.60

stock-summary
Return on Equity

6.25%

stock-summary
Price to Book

1.87

Revenue and Profits:
Net Sales:
3,034 Cr
(Quarterly Results - Jun 2026)
Net Profit:
585 Cr
stock-summaryTotal Returns
Total Returns (Price + Dividend) stock-summary
Dividend Yield (0.75%)
TimePeriod
Price Return
Dividend Return
Total Return
3 Months
14.78%
0.31%
15.09%
6 Months
26.46%
0.60%
27.06%
1 Year
14.68%
0.85%
15.53%
2 Years
61.46%
2.40%
63.86%
3 Years
128.56%
5.94%
134.5%
4 Years
213.27%
11.46%
224.73%
5 Years
100.3%
7.17%
107.47%

Latest dividend: 1 per share ex-dividend date: Aug-17-2026

Risk Adjusted Returns v/s stock-summary
Returns Beta
Icon
Beta has not been calculated since enough price history is not available
stock-summaryNews & Corporate Actions

Announcements stock-summary

Announcement under Regulation 30 (LODR)-Newspaper Publication

04-Sep-2026 | Source : BSE

Newspaper Advertisement of Notice of Transfer of shares of MAFIL in respect of which dividend has not been claimed for seven consecutive years or more to the IEPF.

Announcement under Regulation 30 (LODR)-Change in Management

01-Sep-2026 | Source : BSE

Please find the attached

Announcement under Regulation 30 (LODR)-Allotment

17-Aug-2026 | Source : BSE

Please find attached

Corporate Actions stock-summary

stock-summary
BOARD MEETING

No Upcoming Board Meetings

stock-summary
DIVIDEND

Manappuram Finance Ltd has declared 50% dividend, ex-date: 17 Aug 26

stock-summary
SPLITS

Manappuram Finance Ltd has announced 2:10 stock split, ex-date: 03 May 10

stock-summary
BONUS

Manappuram Finance Ltd has announced 1:1 bonus issue, ex-date: 09 Jun 11

stock-summary
RIGHTS

No Rights history available

stock-summaryKey Factors

Quality key factors stock-summary

Factor
Value
Sales Growth (5y)
9.95%
EBIT Growth (5y)
6.20%
Net Debt to Equity (avg)
3.60
Institutional Holding
37.15%
ROE (avg)
13.27%

Valuation key factors

Factor
Value
P/E Ratio
21
Industry P/E
20
Price to Book Value
1.93
EV to EBIT
13.50
EV to EBITDA
12.85
EV to Capital Employed
1.22
EV to Sales
8.05
PEG Ratio
0.34
Dividend Yield
0.73%
ROCE (Latest)
7.43%
ROE (Latest)
6.25%

Technicals key factors

Indicator
Weekly
Monthly
MACD
Mildly Bearish
Bullish
RSI
No Signal
No Signal
Bollinger Bands
Sideways
Mildly Bullish
Moving Averages
Mildly Bullish (Daily)
KST
Mildly Bearish
Mildly Bearish
Dow Theory
Mildly Bearish
Bullish
OBV
Mildly Bearish
No Trend
stock-summary Technical Indicator Scale: Bearish, Mildly Bearish, Sideways, Mildly Bullish, Bullish  Turned 
stock-summaryShareholding
Shareholding Snapshot : Jun 2026stock-summary
Shareholding Compare (%holding) stock-summary
Majority shareholders

Promoters

Pledged Promoter Holdings

None

Mutual Funds

Held by 33 Schemes (12.84%)

FIIs

Held by 184 FIIs (22.3%)

Promoter with highest holding

Nandakumar V P (26.18%)

Highest Public shareholder

Smallcap World Fund, Inc (5.49%)

Individual Investors Holdings

15.56%

stock-summaryFinancial
[
  {
    "link": "quarterly",
    "btn_text": "All Quarterly Results",
    "header": "Quarterly Results Snapshot (Consolidated) - Jun'26 - QoQ",
    "rhs": [
      {
        "prefix": "Net Sales ",
        "suffix": "QoQ Growth in quarter ended Jun 2026 is 16.08% vs 11.03% in Mar 2026",
        "dir": 1
      },
      {
        "prefix": "Consolidated Net Profit ",
        "suffix": "QoQ Growth in quarter ended Jun 2026 is 44.71% vs 67.58% in Mar 2026",
        "dir": -1
      }
    ],
    "table": {
      "header": [
        "Jun'26",
        "Mar'26",
        "Change(%)"
      ],
      "body": [
        {
          "field": "Net Sales",
          "val1": "3,034.16",
          "val2": "2,613.83",
          "chgp": "16.08%",
          "chgp_class": "positive"
        },
        {
          "field": "Operating Profit (PBDIT) excl Other Income",
          "val1": "2,128.02",
          "val2": "1,736.64",
          "chgp": "22.54%",
          "chgp_class": "positive"
        },
        {
          "field": "Interest",
          "val1": "1,273.96",
          "val2": "1,109.49",
          "chgp": "14.82%",
          "chgp_class": "negative"
        },
        {
          "field": "Exceptional Items",
          "val1": "0.00",
          "val2": "0.00",
          "chgp": "",
          "chgp_class": "neutral"
        },
        {
          "field": "Consolidate Net Profit",
          "val1": "584.58",
          "val2": "403.96",
          "chgp": "44.71%",
          "chgp_class": "positive"
        },
        {
          "field": "Operating Profit Margin (Excl OI)",
          "val1": "70.14%",
          "val2": "66.44%",
          "chgp": "3.70%",
          "chgp_class": "positive"
        }
      ]
    }
  },
  {
    "link": "half-yearly",
    "btn_text": "All Half Yearly Results",
    "header": "Half Yearly Results Snapshot (Consolidated) - Sep'25",
    "rhs": [
      {
        "prefix": "Net Sales ",
        "suffix": " Growth in half year ended Sep 2025 is -11.24% vs 22.20% in Sep 2024",
        "dir": -1
      },
      {
        "prefix": "Consolidated Net Profit ",
        "suffix": " Growth in half year ended Sep 2025 is -68.16% vs 6.73% in Sep 2024",
        "dir": -1
      }
    ],
    "table": {
      "header": [
        "Sep'25",
        "Sep'24",
        "Change(%)"
      ],
      "body": [
        {
          "field": "Net Sales",
          "val1": "4,545.85",
          "val2": "5,121.32",
          "chgp": "-11.24%",
          "chgp_class": "negative"
        },
        {
          "field": "Operating Profit (PBDIT) excl Other Income",
          "val1": "2,284.24",
          "val2": "3,382.71",
          "chgp": "-32.47%",
          "chgp_class": "negative"
        },
        {
          "field": "Interest",
          "val1": "1,730.91",
          "val2": "1,754.01",
          "chgp": "-1.32%",
          "chgp_class": "positive"
        },
        {
          "field": "Exceptional Items",
          "val1": "0.00",
          "val2": "0.00",
          "chgp": "",
          "chgp_class": "neutral"
        },
        {
          "field": "Consolidate Net Profit",
          "val1": "358.29",
          "val2": "1,125.27",
          "chgp": "-68.16%",
          "chgp_class": "negative"
        },
        {
          "field": "Operating Profit Margin (Excl OI)",
          "val1": "50.25%",
          "val2": "66.05%",
          "chgp": "-15.80%",
          "chgp_class": "negative"
        }
      ]
    }
  },
  {
    "link": "nine-monthly",
    "btn_text": "All Nine Monthly Results",
    "header": "Nine Monthly Results Snapshot (Consolidated) - Dec'25",
    "rhs": [
      {
        "prefix": "Net Sales ",
        "suffix": "YoY Growth in nine months ended Dec 2025 is -10.17% vs 18.24% in Dec 2024",
        "dir": -1
      },
      {
        "prefix": "Consolidated Net Profit ",
        "suffix": "YoY Growth in nine months ended Dec 2025 is -57.41% vs -13.51% in Dec 2024",
        "dir": -1
      }
    ],
    "table": {
      "header": [
        "Dec'25",
        "Dec'24",
        "Change(%)"
      ],
      "body": [
        {
          "field": "Net Sales",
          "val1": "6,899.96",
          "val2": "7,681.04",
          "chgp": "-10.17%",
          "chgp_class": "negative"
        },
        {
          "field": "Operating Profit (PBDIT) excl Other Income",
          "val1": "3,604.77",
          "val2": "4,751.67",
          "chgp": "-24.14%",
          "chgp_class": "negative"
        },
        {
          "field": "Interest",
          "val1": "2,676.12",
          "val2": "2,679.35",
          "chgp": "-0.12%",
          "chgp_class": "positive"
        },
        {
          "field": "Exceptional Items",
          "val1": "0.00",
          "val2": "0.00",
          "chgp": "",
          "chgp_class": "neutral"
        },
        {
          "field": "Consolidate Net Profit",
          "val1": "599.35",
          "val2": "1,407.33",
          "chgp": "-57.41%",
          "chgp_class": "negative"
        },
        {
          "field": "Operating Profit Margin (Excl OI)",
          "val1": "52.24%",
          "val2": "61.86%",
          "chgp": "-9.62%",
          "chgp_class": "negative"
        }
      ]
    }
  },
  {
    "link": "annual",
    "btn_text": "All Annual Results",
    "header": "Annual Results Snapshot (Consolidated) - Mar'26",
    "rhs": [
      {
        "prefix": "Net Sales ",
        "suffix": "YoY Growth in year ended Mar 2026 is -5.01% vs 13.15% in Mar 2025",
        "dir": -1
      },
      {
        "prefix": "Consolidated Net Profit ",
        "suffix": "YoY Growth in year ended Mar 2026 is -17.50% vs -44.43% in Mar 2025",
        "dir": 1
      }
    ],
    "table": {
      "header": [
        "Mar'26",
        "Mar'25",
        "Change(%)"
      ],
      "body": [
        {
          "field": "Net Sales",
          "val1": "9,509.39",
          "val2": "10,011.21",
          "chgp": "-5.01%",
          "chgp_class": "negative"
        },
        {
          "field": "Operating Profit (PBDIT) excl Other Income",
          "val1": "5,347.08",
          "val2": "5,453.99",
          "chgp": "-1.96%",
          "chgp_class": "negative"
        },
        {
          "field": "Interest",
          "val1": "3,785.61",
          "val2": "3,540.92",
          "chgp": "6.91%",
          "chgp_class": "negative"
        },
        {
          "field": "Exceptional Items",
          "val1": "0.00",
          "val2": "0.00",
          "chgp": "",
          "chgp_class": "neutral"
        },
        {
          "field": "Consolidate Net Profit",
          "val1": "1,003.30",
          "val2": "1,216.15",
          "chgp": "-17.50%",
          "chgp_class": "negative"
        },
        {
          "field": "Operating Profit Margin (Excl OI)",
          "val1": "56.23%",
          "val2": "54.48%",
          "chgp": "1.75%",
          "chgp_class": "positive"
        }
      ]
    }
  }
]

Quarterly Results Snapshot (Consolidated) - Jun'26 - QoQstock-summary

Jun'26
Mar'26
Change(%)
Net Sales
3,034.16
2,613.83
16.08%
Operating Profit (PBDIT) excl Other Income
2,128.02
1,736.64
22.54%
Interest
1,273.96
1,109.49
14.82%
Exceptional Items
0.00
0.00
Consolidate Net Profit
584.58
403.96
44.71%
Operating Profit Margin (Excl OI)
70.14%
66.44%
3.70%
Values in Rs Cr.
Direction Arrows
Net Sales

QoQ Growth in quarter ended Jun 2026 is 16.08% vs 11.03% in Mar 2026

Direction Arrows
Consolidated Net Profit

QoQ Growth in quarter ended Jun 2026 is 44.71% vs 67.58% in Mar 2026

Half Yearly Results Snapshot (Consolidated) - Sep'25stock-summary

Sep'25
Sep'24
Change(%)
Net Sales
4,545.85
5,121.32
-11.24%
Operating Profit (PBDIT) excl Other Income
2,284.24
3,382.71
-32.47%
Interest
1,730.91
1,754.01
-1.32%
Exceptional Items
0.00
0.00
Consolidate Net Profit
358.29
1,125.27
-68.16%
Operating Profit Margin (Excl OI)
50.25%
66.05%
-15.80%
Values in Rs Cr.
Direction Arrows
Net Sales

Growth in half year ended Sep 2025 is -11.24% vs 22.20% in Sep 2024

Direction Arrows
Consolidated Net Profit

Growth in half year ended Sep 2025 is -68.16% vs 6.73% in Sep 2024

Nine Monthly Results Snapshot (Consolidated) - Dec'25stock-summary

Dec'25
Dec'24
Change(%)
Net Sales
6,899.96
7,681.04
-10.17%
Operating Profit (PBDIT) excl Other Income
3,604.77
4,751.67
-24.14%
Interest
2,676.12
2,679.35
-0.12%
Exceptional Items
0.00
0.00
Consolidate Net Profit
599.35
1,407.33
-57.41%
Operating Profit Margin (Excl OI)
52.24%
61.86%
-9.62%
Values in Rs Cr.
Direction Arrows
Net Sales

YoY Growth in nine months ended Dec 2025 is -10.17% vs 18.24% in Dec 2024

Direction Arrows
Consolidated Net Profit

YoY Growth in nine months ended Dec 2025 is -57.41% vs -13.51% in Dec 2024

Annual Results Snapshot (Consolidated) - Mar'26stock-summary

Mar'26
Mar'25
Change(%)
Net Sales
9,509.39
10,011.21
-5.01%
Operating Profit (PBDIT) excl Other Income
5,347.08
5,453.99
-1.96%
Interest
3,785.61
3,540.92
6.91%
Exceptional Items
0.00
0.00
Consolidate Net Profit
1,003.30
1,216.15
-17.50%
Operating Profit Margin (Excl OI)
56.23%
54.48%
1.75%
Values in Rs Cr.
Direction Arrows
Net Sales

YoY Growth in year ended Mar 2026 is -5.01% vs 13.15% in Mar 2025

Direction Arrows
Consolidated Net Profit

YoY Growth in year ended Mar 2026 is -17.50% vs -44.43% in Mar 2025

stock-summaryCompany CV
About Manappuram Finance Ltd stock-summary
stock-summary
Manappuram Finance Ltd
Small Cap
Non Banking Financial Company (NBFC)
Manappuram Finance Limited was initially incorporated as 'Manappuram General Finance and Leasing Limited' on July 15, 1992 in Valapad, Thrissur, Kerala as a Public Limited Company. The Company's name was changed to Manappuram Finance Limited on June 22, 2011. Company began as a modest money-lending operation. Over the decades, it has evolved into a diversified financial services provider for products including gold loans, microfinance, housing finance, vehicle loans, and SME financing.
Company Coordinates stock-summary
Company Details
IV/470A (Old) W/638 (New), Manappuram House Valpad P O Thrissur Kerala : 680567
stock-summary
Tel: 91-487-3050108/3050000/3050100
stock-summary
cosecretary@manappuram.com
Registrar Details
SKDC Consultants Ltd , Kanapathy Towers, 3rd Floor, Ganapathy, Coimbatore