
Compare Manorama Indust. with Similar Stocks
Dashboard
High Management Efficiency with a high ROCE of 19.17%
Healthy long term growth as Net Sales has grown by an annual rate of 46.29% and Operating profit at 66.54%
The company has declared Positive results for the last 7 consecutive quarters
Majority shareholders : Promoters
Consistent Returns over the last 3 years
Total Returns (Price + Dividend) 
Latest dividend: 0.6 per share ex-dividend date: Aug-21-2025
Risk Adjusted Returns v/s
Returns Beta

News

Manorama Industries Ltd is Rated Buy
Manorama Industries Ltd is rated 'Buy' by MarketsMOJO, with this rating last updated on 13 July 2026. However, the analysis and financial metrics discussed here reflect the stock's current position as of 25 July 2026, providing investors with the most recent insights into the company’s performance and outlook.
Read full news article
Manorama Industries Ltd Upgraded to Buy on Strong Financial and Technical Performance
Manorama Industries Ltd, a small-cap player in the FMCG sector, has seen its investment rating upgraded from Hold to Buy, reflecting significant improvements across technical indicators, financial trends, valuation metrics, and overall quality. This upgrade, effective from 13 July 2026, is underpinned by robust quarterly results, sustained growth, and bullish technical signals that have strengthened investor confidence in the stock’s medium to long-term prospects.
Read full news article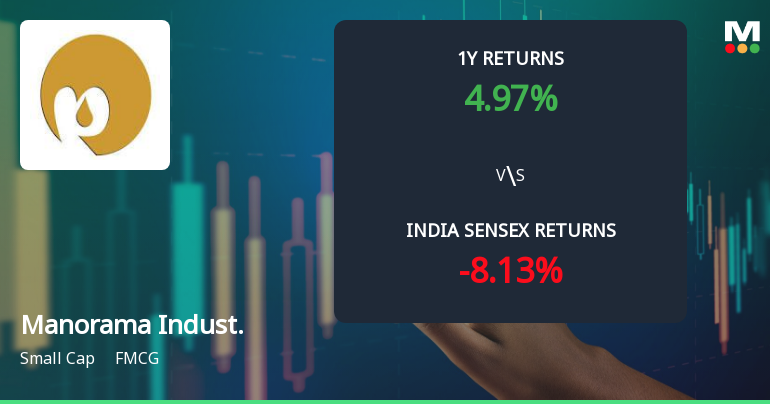
Manorama Industries Ltd Technical Momentum Shifts Signal Bullish Outlook
Manorama Industries Ltd, a small-cap player in the FMCG sector, has witnessed a notable shift in its technical momentum, moving from a mildly bullish stance to a more confident bullish trend. This change is underscored by a series of mixed yet predominantly positive technical indicators, signalling potential opportunities and caution points for investors as the stock trades near ₹1,580.
Read full news article Announcements
Manorama Industries Limited Has Informed The Exchange About Incorporation Of Wholly Owned Subsidiary Company In Republic Of Chad.
21-Jul-2026 | Source : BSEManorama Industries Limited has informed the Exchange about the Incorporation of Wholly Owned Subsidiary company in Republic of Chad.
Compliances-Certificate under Reg. 74 (5) of SEBI (DP) Regulations 2018
10-Jul-2026 | Source : BSECompliance Certificate under Regulation 74(5) of the SEBI (Depositories and Participants) Regulations 2018 for the quarter ended June 30 2026.
Board Meeting Outcome for Outcome Of Board Meeting In Respect Of Incorporation Of Wholly Owned Subsidiary Company In CHAD.
09-Jul-2026 | Source : BSEOutcome of Board meeting in respect of incorporation of Wholly Owned Subsidiary Company in CHAD.
Corporate Actions

No Upcoming Board Meetings

Manorama Industries Ltd has declared 30% dividend, ex-date: 21 Aug 25

Manorama Industries Ltd has announced 2:10 stock split, ex-date: 07 Mar 24

No Bonus history available

No Rights history available
Quality key factors
Valuation key factors
Technicals key factors
 Technical Indicator Scale: Bearish, Mildly Bearish, Sideways, Mildly Bullish, Bullish Turned
 Shareholding Snapshot : Jun 2026
Shareholding Compare (%holding)
Promoters
None
Held by 9 Schemes (2.27%)
Held by 70 FIIs (3.22%)
Ashish Ramesh Saraf (46.17%)
Ritu Saraf (7.1%)
33.46%
Quarterly Results Snapshot (Standalone) - Mar'26 - QoQ

QoQ Growth in quarter ended Mar 2026 is 5.45% vs 12.13% in Dec 2025
QoQ Growth in quarter ended Mar 2026 is -12.78% vs 24.34% in Dec 2025
Half Yearly Results Snapshot (Standalone) - Sep'25

Growth in half year ended Sep 2025 is 86.38% vs 43.41% in Sep 2024
Growth in half year ended Sep 2025 is 162.01% vs 99.65% in Sep 2024
Nine Monthly Results Snapshot (Standalone) - Dec'25
YoY Growth in nine months ended Dec 2025 is 81.29% vs 64.16% in Dec 2024
YoY Growth in nine months ended Dec 2025 is 148.93% vs 152.83% in Dec 2024
Annual Results Snapshot (Standalone) - Mar'26
YoY Growth in year ended Mar 2026 is 76.13% vs 68.64% in Mar 2025
YoY Growth in year ended Mar 2026 is 108.14% vs 179.36% in Mar 2025
About Manorama Industries Ltd

Company Coordinates


