
Compare Marathon Nextgen with Similar Stocks
Dashboard
Low ability to service debt as the company has a high Debt to EBITDA ratio of 0.81 times
- Low ability to service debt as the company has a high Debt to EBITDA ratio of 0.81 times
- The company has been able to generate a Return on Capital Employed (avg) of 9.90% signifying low profitability per unit of total capital (equity and debt)
Poor long term growth as Operating profit has grown by an annual rate 15.78% of over the last 5 years
Negative results in Mar 26
With ROE of 9, it has a Very Expensive valuation with a 1.2 Price to Book Value
Total Returns (Price + Dividend) 
Latest dividend: 1.0004556500607535 per share ex-dividend date: Sep-19-2025
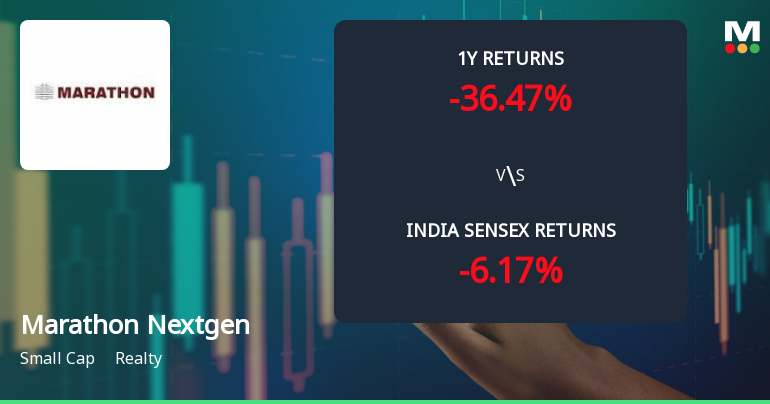
Risk Adjusted Returns v/s
Returns Beta

News
Marathon Nextgen Realty Ltd Technical Momentum Shifts Amid Bearish Sentiment
Marathon Nextgen Realty Ltd, a small-cap player in the Realty sector, has experienced a notable shift in its technical parameters, reflecting a complex interplay of bearish and mildly bullish signals. Despite a recent uptick in price, the overall momentum remains subdued, with key indicators such as MACD and moving averages signalling caution for investors.
Read full news article
Marathon Nextgen Realty Ltd is Rated Strong Sell
Marathon Nextgen Realty Ltd is rated Strong Sell by MarketsMOJO, with this rating last updated on 14 February 2026. However, the analysis and financial metrics discussed here reflect the stock's current position as of 14 June 2026, providing investors with an up-to-date perspective on the company’s performance and outlook.
Read full news article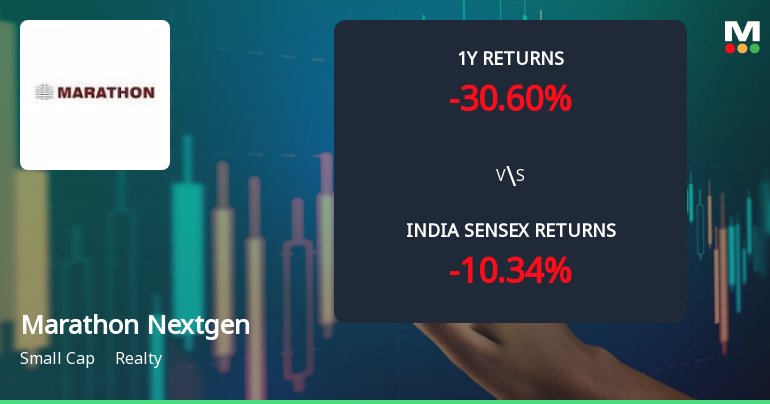
Marathon Nextgen Realty Ltd Faces Bearish Momentum Amid Technical Downgrade
Marathon Nextgen Realty Ltd, a small-cap player in the realty sector, has experienced a notable shift in its technical momentum, with key indicators signalling a bearish trend. Despite a modest day gain of 1.17%, the stock’s broader technical parameters and price momentum reveal growing headwinds, prompting a downgrade in its Mojo Grade to Strong Sell as of 17 Nov 2025.
Read full news article Announcements
Announcement under Regulation 30 (LODR)-Newspaper Publication
10-Jun-2026 | Source : BSEPlease find enclosed herewith the copy of Newspaper advertisement published on June 10 2026.
Announcement under Regulation 30 (LODR)-Change in Management
10-Jun-2026 | Source : BSEMarathon Nextgen Realty Limited has informed the exchange regarding resignation of Mr. Deepak Ramkrishna Assistant General Manager - Marketing designated as SMP
Announcement under Regulation 30 (LODR)-Earnings Call Transcript
05-Jun-2026 | Source : BSETranscript of Q4 & FY 26 Earning Conference Call held on June 1 2026.
Corporate Actions

No Upcoming Board Meetings

Marathon Nextgen Realty Ltd has declared 20% dividend, ex-date: 19 Sep 25

Marathon Nextgen Realty Ltd has announced 5:10 stock split, ex-date: 05 Apr 18

Marathon Nextgen Realty Ltd has announced 1:2 bonus issue, ex-date: 21 Dec 15

No Rights history available
Quality key factors
Valuation key factors
Technicals key factors
 Technical Indicator Scale: Bearish, Mildly Bearish, Sideways, Mildly Bullish, Bullish Turned
 Shareholding Snapshot : Mar 2026
Shareholding Compare (%holding)
Promoters
None
Held by 2 Schemes (9.94%)
Held by 18 FIIs (5.09%)
Marathon Realty Pvt Ltd (51.15%)
Quant Mutual Fund - Quant Small Cap Fund (9.94%)
15.7%
Quarterly Results Snapshot (Consolidated) - Mar'26 - QoQ

QoQ Growth in quarter ended Mar 2026 is -9.09% vs 6.89% in Dec 2025

QoQ Growth in quarter ended Mar 2026 is 38.26% vs -51.05% in Dec 2025
Half Yearly Results Snapshot (Consolidated) - Sep'25
Growth in half year ended Sep 2025 is -16.40% vs -9.03% in Sep 2024
Growth in half year ended Sep 2025 is 47.51% vs 11.58% in Sep 2024
Nine Monthly Results Snapshot (Consolidated) - Dec'25
YoY Growth in nine months ended Dec 2025 is -11.35% vs -21.42% in Dec 2024
YoY Growth in nine months ended Dec 2025 is 18.76% vs 5.22% in Dec 2024
Annual Results Snapshot (Consolidated) - Mar'26
YoY Growth in year ended Mar 2026 is -14.48% vs -17.67% in Mar 2025
YoY Growth in year ended Mar 2026 is 8.80% vs 12.06% in Mar 2025
About Marathon Nextgen Realty Ltd

Company Coordinates


