
Compare Marathon Nextgen with Similar Stocks
Dashboard
Low ability to service debt as the company has a high Debt to EBITDA ratio of 0.81 times
- Low ability to service debt as the company has a high Debt to EBITDA ratio of 0.81 times
- The company has been able to generate a Return on Capital Employed (avg) of 9.90% signifying low profitability per unit of total capital (equity and debt)
Poor long term growth as Operating profit has grown by an annual rate 15.78% of over the last 5 years
Negative results in Mar 26
With ROE of 9, it has a Very Expensive valuation with a 1.2 Price to Book Value
Below par performance in long term as well as near term
Total Returns (Price + Dividend) 
Latest dividend: 1.0004556500607535 per share ex-dividend date: Sep-19-2025
Risk Adjusted Returns v/s
Returns Beta

News

Marathon Nextgen Realty Ltd is Rated Strong Sell
Marathon Nextgen Realty Ltd is rated Strong Sell by MarketsMOJO. This rating was last updated on 14 February 2026, reflecting a shift from the previous 'Sell' grade. However, the analysis and financial metrics discussed below represent the stock's current position as of 17 July 2026, providing investors with the latest insights into its performance and outlook.
Read full news article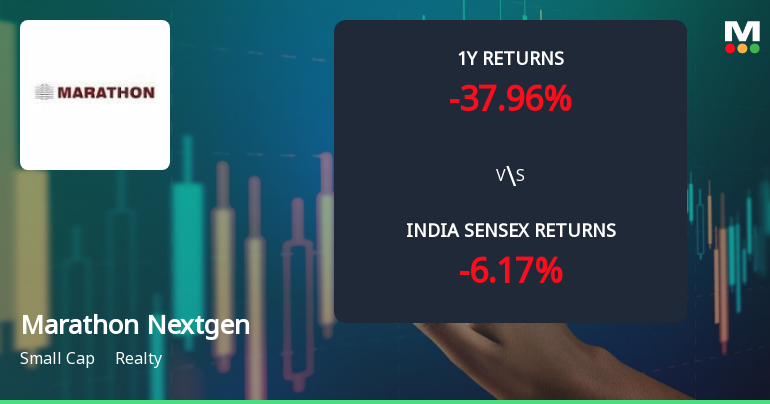
Marathon Nextgen Realty Ltd Faces Bearish Momentum Amid Technical Downgrade
Marathon Nextgen Realty Ltd, a small-cap player in the Realty sector, has experienced a notable shift in its technical momentum, with key indicators signalling a bearish trend. Despite sporadic short-term gains, the stock’s overall trajectory remains under pressure, reflecting broader challenges within the sector and the company’s fundamentals.
Read full news article
Marathon Nextgen Realty Ltd is Rated Strong Sell
Marathon Nextgen Realty Ltd is rated Strong Sell by MarketsMOJO. This rating was last updated on 14 February 2026, reflecting a reassessment of the stock’s outlook. However, all fundamentals, returns, and financial metrics discussed below are current as of 06 July 2026, providing investors with the latest perspective on the company’s position.
Read full news article Announcements
Announcement under Regulation 30 (LODR)-Allotment of ESOP / ESPS
14-Jul-2026 | Source : BSEPlease find enclosed intimation regarding allotment of ESOP
Compliances-Certificate under Reg. 74 (5) of SEBI (DP) Regulations 2018
09-Jul-2026 | Source : BSEPlease find enclosed herewith the Certificate under Regulation 74 (5) of SEBI (DP) Regulations 2018 for the quarter ended June 30 2026.
Announcement under Regulation 30 (LODR)-Press Release / Media Release
03-Jul-2026 | Source : BSEPlease find attached copy of Press Release Titled Marathon expands Mumbai footprint with Rs. 450+ Crore GDV Versova Premium Redevelopment Project
Corporate Actions

No Upcoming Board Meetings

Marathon Nextgen Realty Ltd has declared 20% dividend, ex-date: 19 Sep 25

Marathon Nextgen Realty Ltd has announced 5:10 stock split, ex-date: 05 Apr 18

Marathon Nextgen Realty Ltd has announced 1:2 bonus issue, ex-date: 21 Dec 15

No Rights history available
Quality key factors
Valuation key factors
Technicals key factors
 Technical Indicator Scale: Bearish, Mildly Bearish, Sideways, Mildly Bullish, Bullish Turned
 Shareholding Snapshot : Mar 2026
Shareholding Compare (%holding)
Promoters
None
Held by 2 Schemes (9.94%)
Held by 18 FIIs (5.09%)
Marathon Realty Pvt Ltd (51.15%)
Quant Mutual Fund - Quant Small Cap Fund (9.94%)
15.7%
Quarterly Results Snapshot (Consolidated) - Mar'26 - QoQ

QoQ Growth in quarter ended Mar 2026 is -9.09% vs 6.89% in Dec 2025

QoQ Growth in quarter ended Mar 2026 is 38.26% vs -51.05% in Dec 2025
Half Yearly Results Snapshot (Consolidated) - Sep'25
Growth in half year ended Sep 2025 is -16.40% vs -9.03% in Sep 2024
Growth in half year ended Sep 2025 is 47.51% vs 11.58% in Sep 2024
Nine Monthly Results Snapshot (Consolidated) - Dec'25
YoY Growth in nine months ended Dec 2025 is -11.35% vs -21.42% in Dec 2024
YoY Growth in nine months ended Dec 2025 is 18.76% vs 5.22% in Dec 2024
Annual Results Snapshot (Consolidated) - Mar'26
YoY Growth in year ended Mar 2026 is -14.48% vs -17.67% in Mar 2025
YoY Growth in year ended Mar 2026 is 8.80% vs 12.06% in Mar 2025
About Marathon Nextgen Realty Ltd

Company Coordinates


