
Compare Marine Electric. with Similar Stocks
Dashboard
Strong ability to service debt as the company has a low Debt to EBITDA ratio of 0.94 times
Healthy long term growth as Net Sales has grown by an annual rate of 28.40% and Operating profit at 34.49%
The company has declared Positive results for the last 5 consecutive quarters
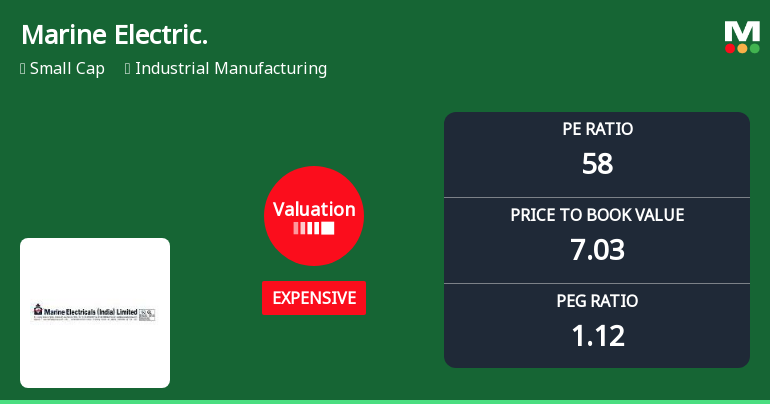
With ROE of 12, it has a Expensive valuation with a 7 Price to Book Value
Falling Participation by Institutional Investors
Stock DNA
Industrial Manufacturing
INR 3,472 Cr (Small Cap)
58.00
36
0.12%
-0.12
12.04%
7.04
Total Returns (Price + Dividend) 
Latest dividend: 0.3 per share ex-dividend date: Sep-12-2025
Risk Adjusted Returns v/s
Returns Beta

News
Marine Electricals (India) Ltd: Valuation Shift Signals Price Attractiveness Change
Marine Electricals (India) Ltd has experienced a notable shift in its valuation parameters, moving from a very expensive to an expensive rating. This change reflects evolving market perceptions and has implications for price attractiveness, especially when analysed against historical trends and peer comparisons within the industrial manufacturing sector.
Read full news article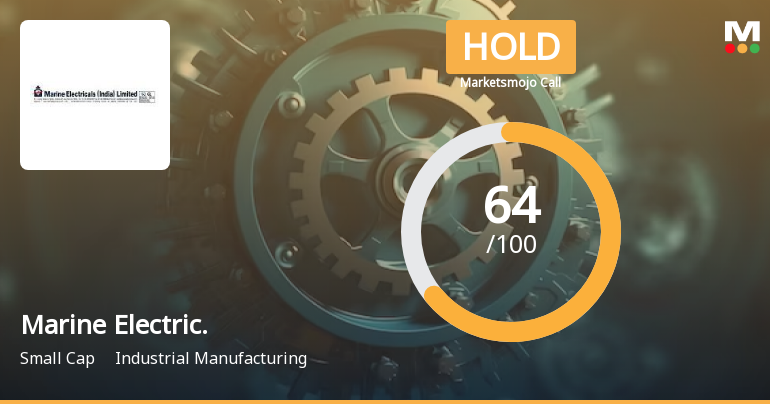
Marine Electricals (India) Ltd is Rated Hold
Marine Electricals (India) Ltd is rated 'Hold' by MarketsMOJO, with this rating last updated on 19 May 2026. However, the analysis and financial metrics discussed here reflect the stock's current position as of 06 July 2026, providing investors with an up-to-date perspective on the company’s performance and outlook.
Read full news article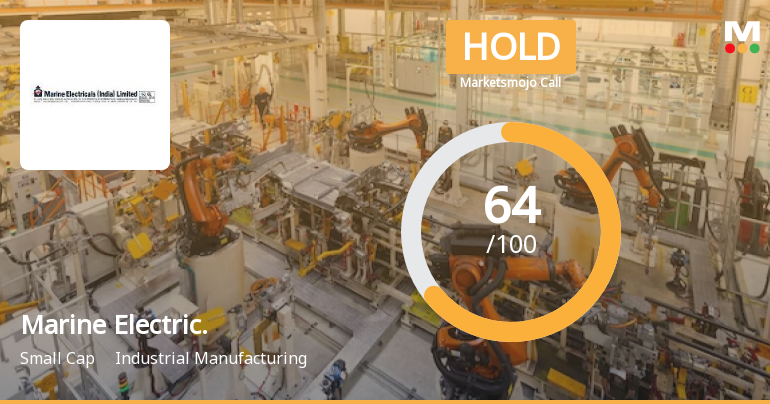
Marine Electricals (India) Ltd is Rated Hold
Marine Electricals (India) Ltd is rated 'Hold' by MarketsMOJO, with this rating last updated on 19 May 2026. However, the analysis and financial metrics discussed here reflect the stock's current position as of 25 June 2026, providing investors with the latest insights into its performance and outlook.
Read full news article Announcements
Marine Electricals (India) Limited - Outcome of Board Meeting
14-Nov-2019 | Source : NSEMarine Electricals (India) Limited has informed the Exchange regarding Board meeting held on November 14, 2019.
Marine Electricals (India) Limited - Updates
05-Nov-2019 | Source : NSEMarine Electricals (India) Limited has informed the Exchange regarding 'Disclosure under Regulation 30 of SEBI (Listing Obligations and Disclosure Requirements) Regulations 2015.'.
Marine Electricals (India) Limited - Resignation
22-Oct-2019 | Source : NSEMarine Electricals (India) Limited has informed the Exchange regarding Resignation of Mr Rohit Shetty as Chief Financial Officer of the company w.e.f. October 19, 2019.
Corporate Actions

No Upcoming Board Meetings

Marine Electricals (India) Ltd has declared 15% dividend, ex-date: 12 Sep 25

Marine Electricals (India) Ltd has announced 2:10 stock split, ex-date: 18 Feb 21

No Bonus history available

No Rights history available
Quality key factors
Valuation key factors
Technicals key factors
 Technical Indicator Scale: Bearish, Mildly Bearish, Sideways, Mildly Bullish, Bullish Turned
 Shareholding Snapshot : Mar 2026
Shareholding Compare (%holding)
Promoters
None
Held by 0 Schemes
Held by 0 FIIs
Kdu Enterprises Private Limited (51.69%)
Ajinkya Mercantile Private Ltd (2.28%)
15.46%
Quarterly Results Snapshot (Consolidated) - Mar'26 - QoQ

QoQ Growth in quarter ended Mar 2026 is 31.99% vs -5.41% in Dec 2025
QoQ Growth in quarter ended Mar 2026 is 56.88% vs -28.56% in Dec 2025
Half Yearly Results Snapshot (Consolidated) - Sep'25

Growth in half year ended Sep 2025 is 20.67% vs 35.31% in Sep 2024
Growth in half year ended Sep 2025 is 41.56% vs 140.31% in Sep 2024
Nine Monthly Results Snapshot (Consolidated) - Dec'25
YoY Growth in nine months ended Dec 2025 is 16.09% vs 34.11% in Dec 2024
YoY Growth in nine months ended Dec 2025 is 59.27% vs 89.12% in Dec 2024
Annual Results Snapshot (Consolidated) - Mar'26
YoY Growth in year ended Mar 2026 is 14.32% vs 23.30% in Mar 2025
YoY Growth in year ended Mar 2026 is 51.89% vs 48.38% in Mar 2025
About Marine Electricals (India) Ltd

Company Coordinates


