
Compare Max Financial with Similar Stocks
Stock DNA
Insurance
INR 58,680 Cr (Mid Cap)
701.00
21
0.00%
0.35
1.57%
10.99
Total Returns (Price + Dividend) 
Latest dividend: 1.8 per share ex-dividend date: Sep-19-2016
Risk Adjusted Returns v/s
Returns Beta

News

Max Financial Services Ltd Downgraded to Sell Amid Mixed Technicals and Weak Financials
Max Financial Services Ltd has seen its investment rating upgraded from Strong Sell to Sell, driven primarily by a shift in technical indicators amid persistent financial challenges. While the company’s fundamentals remain under pressure with declining profitability and high valuation concerns, recent technical trends have stabilised, prompting a reassessment of its market stance.
Read full news article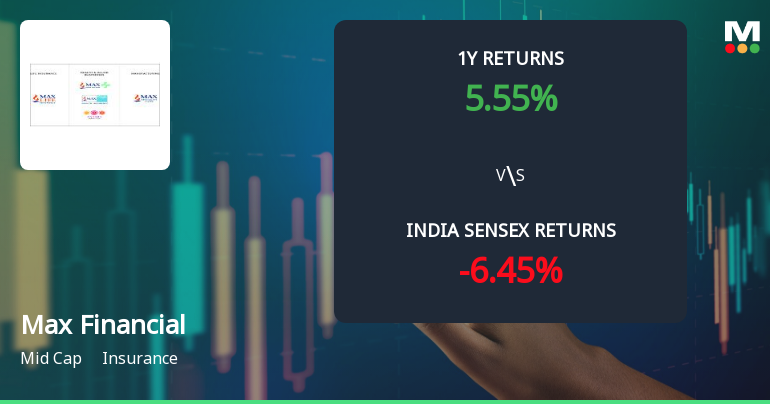
Max Financial Services Ltd Technical Momentum Shifts Amid Mixed Market Signals
Max Financial Services Ltd has exhibited a nuanced shift in its technical momentum, transitioning from a mildly bearish stance to a sideways trend. Despite a modest day gain of 0.67%, the stock’s technical indicators present a complex picture, with bullish signals on weekly MACD and Bollinger Bands contrasting with mildly bearish monthly trends and daily moving averages. This article analyses these technical parameters in detail, alongside the stock’s recent price action and comparative returns against the Sensex.
Read full news article
Max Financial Services Ltd is Rated Strong Sell
Max Financial Services Ltd is rated Strong Sell by MarketsMOJO. This rating was last updated on 15 May 2026, reflecting a reassessment of the stock’s outlook. However, all fundamentals, returns, and financial metrics discussed below are current as of 20 June 2026, providing investors with the latest perspective on the company’s position.
Read full news article Announcements
Announcement under Regulation 30 (LODR)-Newspaper Publication
06-Jun-2026 | Source : BSEAs per the disclosure attached
Shareholder Meeting / Postal Ballot-Notice of Postal Ballot
05-Jun-2026 | Source : BSEAs per the disclosure attached
Intimation Regarding Allotment Of Equity Shares By Axis Max Life Insurance Limited The Material Subsidiary Of The Company
01-Jun-2026 | Source : BSEAs per the disclosure attached
Corporate Actions

No Upcoming Board Meetings

Max Financial Services Ltd has declared 90% dividend, ex-date: 19 Sep 16

Max Financial Services Ltd has announced 2:10 stock split, ex-date: 12 Mar 07

No Bonus history available

No Rights history available
Quality key factors
Valuation key factors
Technicals key factors
 Technical Indicator Scale: Bearish, Mildly Bearish, Sideways, Mildly Bullish, Bullish Turned
 Shareholding Snapshot : Mar 2026
Shareholding Compare (%holding)
FIIs
42.0735
Held by 39 Schemes (36.99%)
Held by 379 FIIs (47.88%)
Max Ventures Investment Holdings Private Limited (1.16%)
Mitsui Sumitomo Insurance Company Limited (21.86%)
4.46%
Quarterly Results Snapshot (Consolidated) - Mar'26 - YoY

YoY Growth in quarter ended Mar 2026 is -12.72% vs -16.87% in Mar 2025

YoY Growth in quarter ended Mar 2026 is -184.16% vs 171.08% in Mar 2025
Half Yearly Results Snapshot (Consolidated) - Sep'25
Growth in half year ended Sep 2025 is -10.16% vs 30.20% in Sep 2024
Growth in half year ended Sep 2025 is -69.25% vs 1.82% in Sep 2024
Nine Monthly Results Snapshot (Consolidated) - Dec'25
YoY Growth in nine months ended Dec 2025 is 8.15% vs 7.59% in Dec 2024
YoY Growth in nine months ended Dec 2025 is -62.72% vs -22.97% in Dec 2024
Annual Results Snapshot (Consolidated) - Mar'26
YoY Growth in year ended Mar 2026 is 2.59% vs -0.23% in Mar 2025
YoY Growth in year ended Mar 2026 is -74.34% vs -3.78% in Mar 2025
About Max Financial Services Ltd

Company Coordinates


