
Compare Meesho with Similar Stocks
Dashboard
With a Operating Losses, the company has a Weak Long Term Fundamental Strength
- Poor long term growth as Operating profit has grown by an annual rate 0% of over the last 5 years
- Company's ability to service its debt is weak with a poor EBIT to Interest (avg) ratio of 0
Flat results in Mar 26
Risky - Negative EBITDA
Stock DNA
E-Retail/ E-Commerce
INR 84,845 Cr (Mid Cap)
NA (Loss Making)
77
0.00%
-0.63
-27.74%
19.63
Total Returns (Price + Dividend) 
Meesho for the last several years.
Risk Adjusted Returns v/s
Returns Beta

News
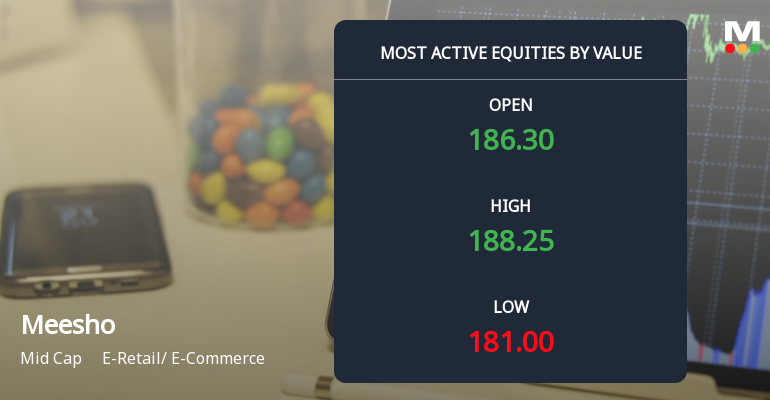
Meesho Ltd Sees High-Value Trading Amid Mixed Market Signals
Meesho Ltd, a prominent player in the E-Retail and E-Commerce sector, witnessed significant trading activity on 24 June 2026, emerging as one of the most active stocks by value on the Indian equity markets. Despite a modest decline in its share price, the stock attracted heightened investor interest, reflected in its substantial turnover and rising delivery volumes, signalling a complex interplay of market sentiment and institutional participation.
Read full news article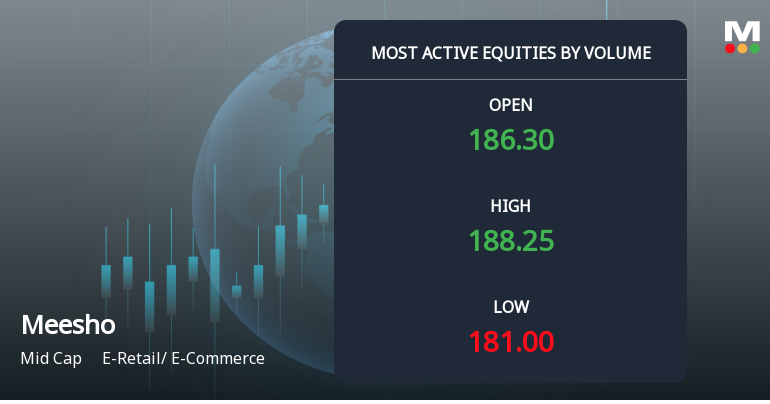
Meesho Ltd Sees Exceptional Volume Amid Mixed Price Action and Moderate Downtrend
Meesho Ltd, a prominent player in the e-retail and e-commerce sector, witnessed one of the highest trading volumes on 24 June 2026, with over 1.41 crore shares changing hands. Despite this surge in activity, the stock underperformed its sector and broader market indices, reflecting a complex interplay of investor sentiment and technical signals.
Read full news article
Meesho Ltd Upgraded to Sell by MarketsMOJO on Improving Technicals
Meesho Ltd, a mid-cap player in the E-Retail sector, has seen its investment rating upgraded from Strong Sell to Sell as of 23 June 2026. This change is primarily driven by a shift in technical indicators signalling a mildly bullish trend, despite persistent fundamental weaknesses and valuation concerns. The company’s stock price surged 8.41% on the day following the upgrade, reflecting renewed investor interest amid mixed financial signals.
Read full news article Announcements
Disclosures under Reg. 29(2) of SEBI (SAST) Regulations 2011
22-Jun-2026 | Source : BSEThe Exchange has received the disclosure under Regulation 29(2) of SEBI (Substantial Acquisition of Shares & Takeovers) Regulations 2011 for FMR LLC & FIL Ltd
Announcement under Regulation 30 (LODR)-Allotment of ESOP / ESPS
20-Jun-2026 | Source : BSEIntimation w.r.t allotment of equity shares pursuant to exercise of ESOP
Closure of Trading Window
15-Jun-2026 | Source : BSEIntimation w.r.t Closure of Trading Window
Corporate Actions

No Upcoming Board Meetings

No Dividend history available

No Splits history available

No Bonus history available

No Rights history available
Quality key factors
Valuation key factors
Technicals key factors
 Technical Indicator Scale: Bearish, Mildly Bearish, Sideways, Mildly Bullish, Bullish Turned
 Shareholding Snapshot : Mar 2026
Shareholding Compare (%holding)
Non Institution
None
Held by 23 Schemes (4.91%)
Held by 113 FIIs (4.17%)
Vidit Aatrey (10.0%)
Elevation Capital V Limited (12.16%)
2.63%
Quarterly Results Snapshot (Standalone) - Mar'26 - QoQ

QoQ Growth in quarter ended Mar 2026 is -12.66% vs 13.50% in Dec 2025
QoQ Growth in quarter ended Mar 2026 is -56.43% vs 3,180.55% in Dec 2025
Annual Results Snapshot (Consolidated) - Mar'26

YoY Growth in year ended Mar 2026 is 34.47% vs 23.31% in Mar 2025
YoY Growth in year ended Mar 2026 is 65.55% vs -1,103.06% in Mar 2025
About Meesho Ltd

Company Coordinates


