
Compare Meghmani Organi. with Similar Stocks
Dashboard
Weak Long Term Fundamental Strength with a -24.33% CAGR growth in Operating Profits over the last 5 years
- The company has been able to generate a Return on Equity (avg) of 7.13% signifying low profitability per unit of shareholders funds
Negative results in Mar 26
Despite the size of the company, domestic mutual funds hold only 0% of the company
Below par performance in long term as well as near term
Stock DNA
Pesticides & Agrochemicals
INR 1,205 Cr (Small Cap)
41.00
20
0.00%
0.45
1.86%
0.77
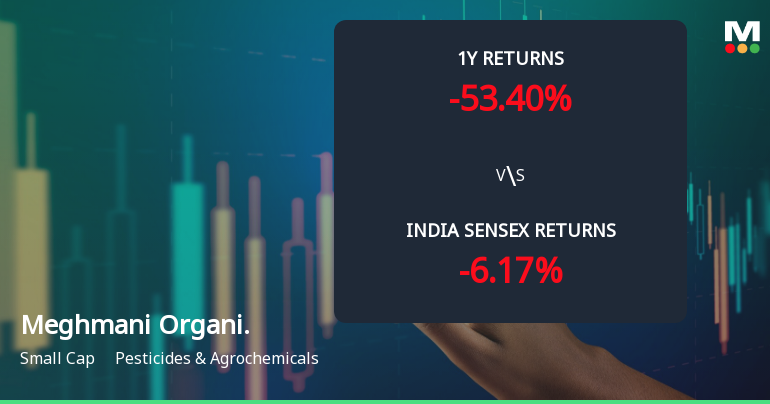
Total Returns (Price + Dividend) 
Latest dividend: 1.4 per share ex-dividend date: Jun-20-2023
Risk Adjusted Returns v/s
Returns Beta

News
Meghmani Organics Ltd Faces Intensified Downtrend Amid Technical Momentum Shift
Meghmani Organics Ltd, a small-cap player in the Pesticides & Agrochemicals sector, is currently exhibiting a pronounced bearish momentum as technical indicators signal a shift towards a more negative trend. The company’s stock price has declined to ₹47.18, down 1.17% on 7 July 2026, reflecting ongoing pressure amid broader market dynamics and sectoral challenges.
Read full news article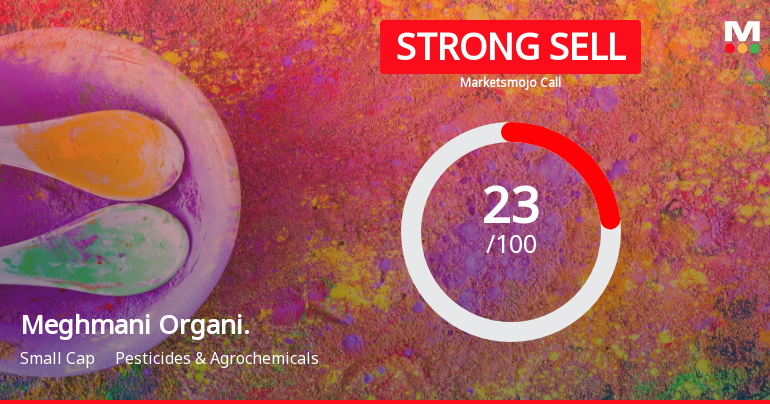
Meghmani Organics Ltd is Rated Strong Sell
Meghmani Organics Ltd is rated Strong Sell by MarketsMOJO, with this rating last updated on 31 January 2026. However, the analysis and financial metrics presented here reflect the company’s current position as of 01 July 2026, providing investors with an up-to-date view of its fundamentals, returns, and overall market standing.
Read full news article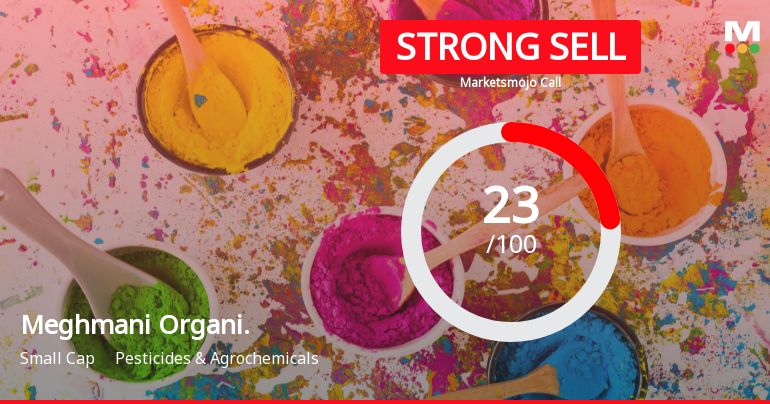
Meghmani Organics Ltd is Rated Strong Sell
Meghmani Organics Ltd is rated Strong Sell by MarketsMOJO, with this rating last updated on 31 January 2026. However, the analysis and financial metrics discussed below reflect the stock’s current position as of 20 June 2026, providing investors with an up-to-date perspective on the company’s performance and outlook.
Read full news article Announcements
Corporate Actions

No Upcoming Board Meetings

Meghmani Organics Ltd has declared 140% dividend, ex-date: 20 Jun 23

No Splits history available

No Bonus history available

No Rights history available
Quality key factors
Valuation key factors
Technicals key factors
 Technical Indicator Scale: Bearish, Mildly Bearish, Sideways, Mildly Bullish, Bullish Turned
 Shareholding Snapshot : Mar 2026
Shareholding Compare (%holding)
Non Institution
None
Held by 1 Schemes (0.0%)
Held by 34 FIIs (1.34%)
Ashishbhai Natawarlal Soparkar (10.59%)
Gadia Naveen Vishwanath (1.28%)
39.28%
Quarterly Results Snapshot (Consolidated) - Mar'26 - QoQ

QoQ Growth in quarter ended Mar 2026 is -6.76% vs -11.87% in Dec 2025
QoQ Growth in quarter ended Mar 2026 is 327.48% vs -130.56% in Dec 2025
Half Yearly Results Snapshot (Consolidated) - Sep'25
Growth in half year ended Sep 2025 is 24.34% vs 19.05% in Sep 2024
Growth in half year ended Sep 2025 is 193.12% vs 47.77% in Sep 2024
Nine Monthly Results Snapshot (Consolidated) - Dec'25

YoY Growth in nine months ended Dec 2025 is 11.36% vs 32.00% in Dec 2024
YoY Growth in nine months ended Dec 2025 is 168.08% vs 65.46% in Dec 2024
Annual Results Snapshot (Consolidated) - Mar'26
YoY Growth in year ended Mar 2026 is 4.53% vs 32.78% in Mar 2025
YoY Growth in year ended Mar 2026 is 371.13% vs 90.00% in Mar 2025
About Meghmani Organics Ltd

Company Coordinates


