
Compare Mishra Dhatu Nig with Similar Stocks
Dashboard
Strong ability to service debt as the company has a low Debt to EBITDA ratio of 1.71 times
Poor long term growth as Operating profit has grown by an annual rate -4.75% of over the last 5 years
Positive results in Mar 26
With ROCE of 9.8, it has a Very Expensive valuation with a 4.3 Enterprise value to Capital Employed
Increasing Participation by Institutional Investors
Below par performance in long term as well as near term
Stock DNA
Aerospace & Defense
INR 7,406 Cr (Small Cap)
56.00
21
0.20%
0.14
8.58%
4.80
Total Returns (Price + Dividend) 
Latest dividend: 0.7999999999999999 per share ex-dividend date: Mar-18-2026
Risk Adjusted Returns v/s
Returns Beta

News
Mishra Dhatu Nigam Ltd is Rated Hold
Mishra Dhatu Nigam Ltd is rated 'Hold' by MarketsMOJO, with this rating last updated on 17 Apr 2026. However, the analysis and financial metrics discussed here reflect the company’s current position as of 28 July 2026, providing investors with an up-to-date view of its fundamentals, valuation, financial trends, and technical outlook.
Read full news article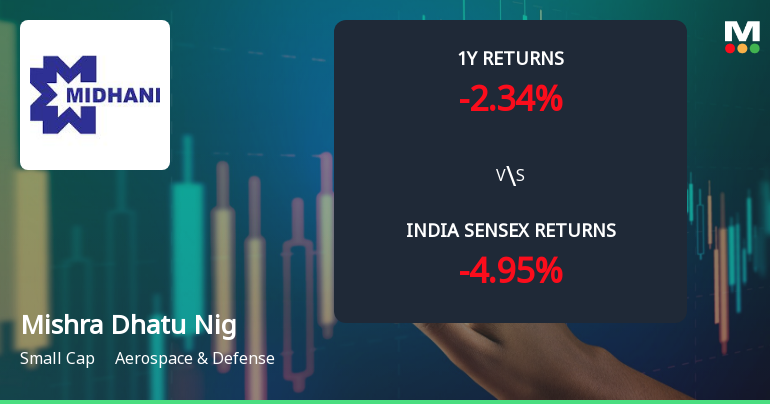
Mishra Dhatu Nigam Ltd Technical Momentum Shifts Amid Mixed Indicator Signals
Mishra Dhatu Nigam Ltd (MDNL), a small-cap player in the Aerospace & Defense sector, has experienced a nuanced shift in its technical momentum, reflecting a complex interplay of bullish and bearish indicators. Recent data reveals a transition from a bullish to a mildly bullish trend, with mixed signals from key technical indicators such as MACD, RSI, and moving averages, underscoring a cautious but optimistic outlook for investors.
Read full news article
Mishra Dhatu Nigam Ltd is Rated Hold by MarketsMOJO
Mishra Dhatu Nigam Ltd is rated 'Hold' by MarketsMOJO, with this rating last updated on 17 April 2026. However, the analysis and financial metrics discussed here reflect the company’s current position as of 17 July 2026, providing investors with an up-to-date view of its fundamentals, valuation, financial trends, and technical outlook.
Read full news article Announcements
Announcement under Regulation 30 (LODR)-Newspaper Publication
18-Jul-2026 | Source : BSECopy of IEPF Newspaper Advertisement.
Compliances-Certificate under Reg. 74 (5) of SEBI (DP) Regulations 2018
06-Jul-2026 | Source : BSECertificate under SEBI (Depositories and Participants) Regulations 2018
Closure of Trading Window
25-Jun-2026 | Source : BSEIntimation regarding closure of Trading window for Q1 FY 2026-27
Corporate Actions

No Upcoming Board Meetings

Mishra Dhatu Nigam Ltd has declared 8% dividend, ex-date: 18 Mar 26

No Splits history available

No Bonus history available

No Rights history available
Quality key factors
Valuation key factors
Technicals key factors
 Technical Indicator Scale: Bearish, Mildly Bearish, Sideways, Mildly Bullish, Bullish Turned
 Shareholding Snapshot : Jun 2026
Shareholding Compare (%holding)
Promoters
None
Held by 9 Schemes (5.81%)
Held by 79 FIIs (2.56%)
President Of India (74.0%)
Hdfc Trustee Company Ltd. A/c Hdfc Balanced Advantage Fund (3.44%)
13.86%
Quarterly Results Snapshot (Consolidated) - Mar'26 - YoY

YoY Growth in quarter ended Mar 2026 is 34.63% vs 1.25% in Mar 2025
YoY Growth in quarter ended Mar 2026 is 38.61% vs 21.28% in Mar 2025
Half Yearly Results Snapshot (Consolidated) - Sep'25

Growth in half year ended Sep 2025 is -10.66% vs 2.50% in Sep 2024
Growth in half year ended Sep 2025 is -10.96% vs -10.81% in Sep 2024
Nine Monthly Results Snapshot (Consolidated) - Dec'25
YoY Growth in nine months ended Dec 2025 is -1.15% vs -0.55% in Dec 2024
YoY Growth in nine months ended Dec 2025 is -1.96% vs 20.22% in Dec 2024
Annual Results Snapshot (Consolidated) - Mar'26
YoY Growth in year ended Mar 2026 is 12.52% vs 0.13% in Mar 2025
YoY Growth in year ended Mar 2026 is 18.61% vs 20.77% in Mar 2025
About Mishra Dhatu Nigam Ltd

Company Coordinates


