
Compare Mishtann Foods with Similar Stocks
Total Returns (Price + Dividend) 
Latest dividend: 0 per share ex-dividend date: Jun-21-2024
Risk Adjusted Returns v/s
Returns Beta

News
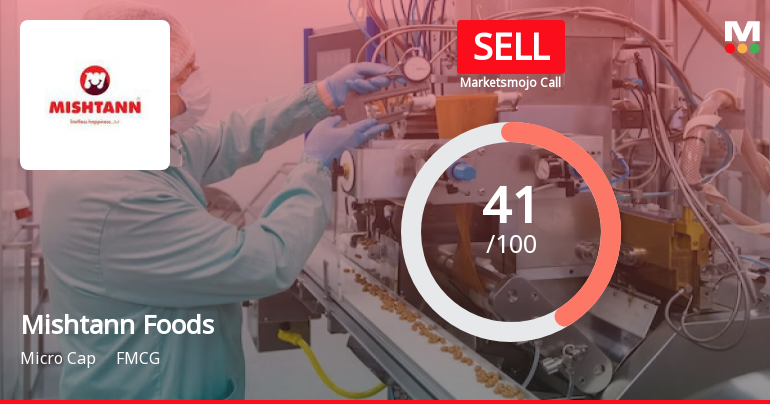
Mishtann Foods Ltd is Rated Sell
Mishtann Foods Ltd is rated Sell by MarketsMOJO, with this rating last updated on 01 June 2026. However, the analysis and financial metrics discussed here reflect the stock’s current position as of 10 June 2026, providing investors with the latest insights into the company’s performance and outlook.
Read full news articleAre Mishtann Foods Ltd latest results good or bad?
The latest financial results for Mishtann Foods Ltd for Q4 FY26 indicate a significant operational downturn. The company reported net sales of ₹30.84 crores, which represents a dramatic decline of 90.70% year-on-year from ₹331.44 crores in Q4 FY25. This marks the lowest quarterly revenue in the company's recent history, raising concerns about the sustainability of its business model. Net profit also saw a substantial drop, falling to ₹0.04 crores, a decrease of 99.95% compared to ₹83.48 crores in the same quarter last year. The operating profit margin contracted sharply to 1.95%, down from 24.53% in the previous quarter, indicating severe margin compression and operational challenges. The PAT margin similarly fell to 0.13%, a significant reduction from the previous average of over 22%. The company's cash flow from operations turned negative at ₹73.00 crores for FY2025, driven by adverse movements in work...
Read full news article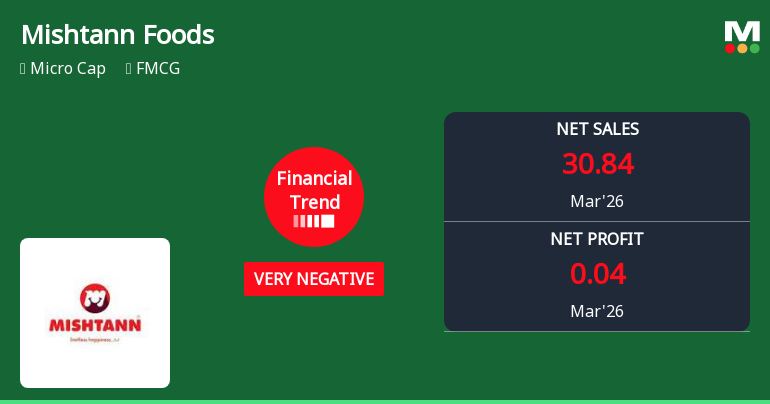
Mishtann Foods Ltd Reports Sharp Decline in Quarterly Performance Amid Financial Downturn
Mishtann Foods Ltd, a micro-cap player in the FMCG sector, has reported a significant deterioration in its financial performance for the quarter ended March 2026, with key metrics plunging to multi-quarter lows. This downturn has prompted a downgrade in its Mojo Grade from Hold to Sell, reflecting growing concerns over the company’s near-term prospects amid a challenging market environment.
Read full news article Announcements
Announcement under Regulation 30 (LODR)-Newspaper Publication
01-Jun-2026 | Source : BSEThe Newspaper Publication for the Audited Standalone and Consolidated Financial Results for the quarter and year ended March 31 2026 has been attached herewith.
Board Meeting Outcome for Outcome Of The Meeting Of Board Of Directors Held On May 30 2026
30-May-2026 | Source : BSEThe outcome of the meeting of the board of directors held on May 30 2026 has been attached herewith.
Announcement under Regulation 30 (LODR)-Change in Management
30-May-2026 | Source : BSEThe intimation for appointment of M/s J. M. Patel & Bros. (FY 2025-26 AY 2026-27) as Tax Auditor and M/s Mikil Vora and Associates (FY 2026-27) as internal Auditor of the company has been attached herewith.
Corporate Actions

No Upcoming Board Meetings


Mishtann Foods Ltd has announced 1:10 stock split, ex-date: 01 Nov 18

Mishtann Foods Ltd has announced 1:1 bonus issue, ex-date: 02 Jun 22

Mishtann Foods Ltd has announced 1:31 rights issue, ex-date: 20 Mar 24
Quality key factors
Valuation key factors
Technicals key factors
 Technical Indicator Scale: Bearish, Mildly Bearish, Sideways, Mildly Bullish, Bullish Turned
 Shareholding Snapshot : Mar 2026
Shareholding Compare (%holding)
Non Institution
None
Held by 0 Schemes
Held by 0 FIIs
Hiteshkumar Gaurishankar Patel (43.48%)
None
53.5%
Quarterly Results Snapshot (Consolidated) - Mar'26 - YoY

YoY Growth in quarter ended Mar 2026 is -90.70% vs -1.82% in Mar 2025
YoY Growth in quarter ended Mar 2026 is -99.95% vs -11.36% in Mar 2025
Half Yearly Results Snapshot (Consolidated) - Sep'25
Growth in half year ended Sep 2025 is 6.62% vs 18.32% in Sep 2024
Growth in half year ended Sep 2025 is 0.13% vs 13.77% in Sep 2024
Nine Monthly Results Snapshot (Consolidated) - Dec'25
YoY Growth in nine months ended Dec 2025 is 5.87% vs 11.07% in Dec 2024

YoY Growth in nine months ended Dec 2025 is 3.52% vs 0.57% in Dec 2024
Annual Results Snapshot (Consolidated) - Mar'26
YoY Growth in year ended Mar 2026 is -16.13% vs 6.77% in Mar 2025
YoY Growth in year ended Mar 2026 is -20.97% vs -3.67% in Mar 2025
About Mishtann Foods Ltd

Company Coordinates


