
Compare MKVentures Cap. with Similar Stocks
Stock DNA
Non Banking Financial Company (NBFC)
INR 347 Cr (Micro Cap)
33.00
85
0.04%
0.00
9.35%
3.06
Total Returns (Price + Dividend) 
Latest dividend: 0.2 per share ex-dividend date: Jun-05-2026
Risk Adjusted Returns v/s
Returns Beta

News

MKVentures Capital Ltd is Rated Strong Sell
MKVentures Capital Ltd is rated Strong Sell by MarketsMOJO. This rating was last updated on 18 Nov 2025, reflecting a shift from the previous 'Sell' grade. However, the analysis and financial metrics discussed here represent the stock's current position as of 10 June 2026, providing investors with an up-to-date view of its performance and outlook.
Read full news article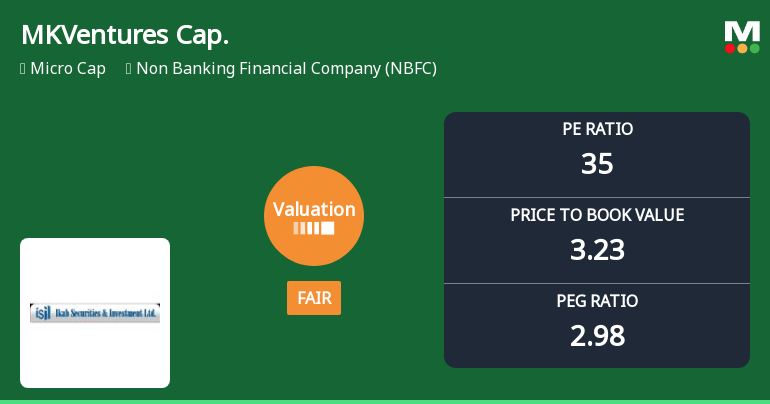
MKVentures Capital Ltd Valuation Shifts Signal Changing Market Sentiment
MKVentures Capital Ltd, a micro-cap player in the Non Banking Financial Company (NBFC) sector, has seen a notable shift in its valuation parameters, moving from a very expensive rating to a fair valuation grade. Despite this improvement, the company’s share price continues to face downward pressure amid broader sector challenges and peer comparisons, raising questions about its price attractiveness and investment appeal.
Read full news articleAre MKVentures Capital Ltd latest results good or bad?
MKVentures Capital Ltd's latest financial results for Q4 FY26 reveal significant operational challenges. The company reported net sales of ₹2.28 crores, which reflects a substantial contraction of 35.96% quarter-on-quarter and 20.83% year-on-year, marking the lowest revenue in recent history. This decline raises concerns about the sustainability of its business model and competitive positioning in the crowded NBFC sector. Net profit for the quarter stood at ₹0.47 crores, representing a sharp decline of 79.83% compared to the previous quarter and a 108.87% decrease year-on-year. Although the company returned to profitability after a loss in the same quarter last year, the absolute profit level remains weak, highlighting ongoing difficulties. The operating profit margin, while reported at 57.52%, has seen a dramatic reduction of 81.12 percentage points from the previous quarter, indicating challenges in mai...
Read full news article Announcements
Announcement under Regulation 30 (LODR)-Newspaper Publication
04-Jun-2026 | Source : BSENewspaper Publication of Postal Ballot Notice
Shareholder Meeting / Postal Ballot-Notice of Postal Ballot
03-Jun-2026 | Source : BSEPlease find enclosed Postal Ballot Notice.
Announcement under Regulation 30 (LODR)-Newspaper Publication
29-May-2026 | Source : BSENewspaper Publication of the Extract of Audited Standalone and Consolidation of Financials Results for the Quarter and Financial Year ended March 31 2026
Corporate Actions

No Upcoming Board Meetings

MKVentures Capital Ltd has declared 2% dividend, ex-date: 05 Jun 26

No Splits history available

No Bonus history available

MKVentures Capital Ltd has announced 1:8 rights issue, ex-date: 03 Apr 23
Quality key factors
Valuation key factors
Technicals key factors
 Technical Indicator Scale: Bearish, Mildly Bearish, Sideways, Mildly Bullish, Bullish Turned
 Shareholding Snapshot : Mar 2026
Shareholding Compare (%holding)
Promoters
None
Held by 0 Schemes
Held by 1 FIIs (4.26%)
Madhusudan Murlidhar Kela (74.36%)
Think India Opportunities Master Fund Lp (4.26%)
17.49%
Quarterly Results Snapshot (Consolidated) - Mar'26 - QoQ

QoQ Growth in quarter ended Mar 2026 is -35.96% vs -41.35% in Dec 2025

QoQ Growth in quarter ended Mar 2026 is -79.83% vs -33.62% in Dec 2025
Half Yearly Results Snapshot (Consolidated) - Sep'25
Growth in half year ended Sep 2025 is -16.38% vs -34.76% in Sep 2024
Growth in half year ended Sep 2025 is -17.11% vs -8.20% in Sep 2024
Nine Monthly Results Snapshot (Consolidated) - Dec'25
YoY Growth in nine months ended Dec 2025 is -29.87% vs -27.07% in Dec 2024
YoY Growth in nine months ended Dec 2025 is -31.55% vs -3.14% in Dec 2024
Annual Results Snapshot (Consolidated) - Mar'26
YoY Growth in year ended Mar 2026 is -28.85% vs -35.43% in Mar 2025
YoY Growth in year ended Mar 2026 is 11.80% vs -55.17% in Mar 2025
About MKVentures Capital Ltd

Company Coordinates


