Modern Shares

  • Market Cap: Micro Cap
  • Industry: Non Banking Financial Company (NBFC)
  • ISIN: INE370A01019
  • NSEID:
  • BSEID: 509760
INR
39.97
-1.33 (-3.22%)
BSENSE

Jan 19

BSE+NSE Vol: 1.24 k

  • Price Points
  • Score
  • Mojo Parameters
  • Total Return
  • News and Corporate Actions
  • Key factors
  • Shareholding
  • Financials
  • CompanyCV
stock-recommendationUpcoming Result: Modern Shares will declare its result soon on 30 Jan 2026
stock-summaryPrice Point
High/Low

1Day

52 Week

Valuation
Technical
Day's Volume

CASH

1.24 k (491.90%) Volume

Shareholding (Dec 2025)

FII

0.00%

Held by 0 FIIs

DII

0.00%

Held by 0 DIIs

Promoter

72.83%

Who are the top shareholders of the Modern Shares?

06-Jun-2025

The top shareholder of Modern Shares is Bhagwanti Exports Private Limited, holding 36.68%. Public shareholder Angelina Vivek Daswani has 3.41%, while individual investors collectively own 14.63%, with no mutual funds or foreign institutional investors involved.

The top shareholders of Modern Shares include Bhagwanti Exports Private Limited, which holds the largest stake at 36.68%. The company is primarily owned by promoters, and there are no pledged promoter holdings. In terms of public shareholders, Angelina Vivek Daswani is the highest with a holding of 3.41%. Additionally, individual investors collectively hold 14.63% of the shares. There are currently no mutual funds or foreign institutional investors (FIIs) holding shares in the company.

View full answer

What does Modern Shares do?

06-Jun-2025

Modern Shares & Stockbrokers Ltd is a Micro Cap stock broking firm established in 1939, with recent quarterly net sales of 1 Cr and a market cap of Rs 14 Cr. The company operates within the Non Banking Financial Company sector and has a P/E ratio of 13.00.

Overview:<BR>Modern Shares & Stockbrokers Ltd is primarily engaged in stock broking and operates within the Non Banking Financial Company (NBFC) sector, categorized as a Micro Cap.<BR><BR>History:<BR>The company was established as a private limited company in 1939 and converted into a public limited company in 1970. The latest quarterly results reported net sales and net profit for March 2025.<BR><BR>Financial Snapshot:<BR>- Most recent Net Sales: 1 Cr (Quarterly Results - Mar 2025)<BR>- Most recent Net Profit: 0 Cr (Quarterly Results - Mar 2025)<BR>- Market-cap value: Rs 14 Cr (Micro Cap)<BR><BR>Key Metrics:<BR>- P/E: 13.00<BR>- Industry P/E: 85<BR>- Dividend Yield: 0.00%<BR>- Debt Equity: 0.00<BR>- Return on Equity: 1.65%<BR>- Price to Book: 1.06<BR><BR>Contact Details:<BR>Address: Wankhede Stadium North Stand, Staircase No 13 D Rd Churchgat Mumbai Maharashtra : 400020<BR>Tel: 91-22-42122400<BR>Email: modernshares@hotmail.com<BR>Website: http://www.modernshares.com

View full answer

Who are in the management team of Modern Shares?

06-Jun-2025

As of March 2023, the management team of Modern Shares includes Ashok T Kukreja (Chairman), Anil S Manghnani (Executive Director), and four Non-Executive Directors: Narendra Hira Advani, G Shewakramani, Roshan Advani Patheria, and Pankaj Rajnikant Ved. Only Anil S Manghnani receives remuneration, totaling 10.81 lacs.

As of March 2023, the management team of Modern Shares includes the following individuals:<BR><BR>1. **Ashok T Kukreja** - Chairman & Independent Director<BR>2. **Anil S Manghnani** - Executive Director & Wholetime Director<BR>3. **Narendra Hira Advani** - Non-Executive Director<BR>4. **G Shewakramani** - Non-Executive Director<BR>5. **Roshan Advani Patheria** - Non-Executive Director<BR>6. **Pankaj Rajnikant Ved** - Independent Non-Executive Director<BR><BR>Anil S Manghnani is the only member of the management team who receives remuneration, amounting to 10.81 lacs.

View full answer

Has Modern Shares declared dividend?

06-Jun-2025

Modern Shares & Stockbrokers Ltd has declared a 5% dividend, amounting to 0.5 per share, but the dividend yield is 0%. While the company has shown significant price appreciation over various periods, the dividend payments have not contributed to returns recently.

Modern Shares & Stockbrokers Ltd has declared a 5% dividend.<BR><BR>Dividend Details:<BR>- Percentage announced: 5%<BR>- Amount per share: 0.5<BR>- Ex-date: Jul-24-2018<BR><BR>Dividend Yield: 0%<BR><BR>Total Returns by Period:<BR>In the 6-month period, the price return was -14.44%, the dividend return was 0%, resulting in a total return of -14.44%.<BR><BR>For the 1-year period, the price return was 3.83%, the dividend return was 0%, leading to a total return of 3.83%.<BR><BR>Over the 2-year period, the price return was 186.74%, with a dividend return of 0%, culminating in a total return of 186.74%.<BR><BR>In the 3-year period, the price return was 130.22%, the dividend return was 0%, which resulted in a total return of 130.22%.<BR><BR>For the 4-year period, the price return was 562.98%, with a dividend return of 0%, giving a total return of 562.98%.<BR><BR>Lastly, in the 5-year period, the price return was 686.89%, the dividend return was 0%, resulting in a total return of 686.89%.<BR><BR>Overall, while Modern Shares has declared a dividend, the dividend yield remains at 0%, indicating that the dividend payments have not contributed to returns in recent periods. The total returns over various periods show significant price appreciation, particularly over longer time frames.

View full answer

Who are the peers of the Modern Shares?

03-Jun-2025

Peers of Modern Shares include Bajaj Finance, Jio Financial, Cholaman.Inv.&Fn, Shriram Finance, Muthoot Finance, Econo Trade Indi, FGP, Inani Securities, and BFL Asset Finves. Modern Shares has average growth and management risk, with a 1-year return of 5.33%, higher than Jio Financial but lower than FGP.

Peers: The peers of Modern Shares are Bajaj Finance, Jio Financial, Cholaman.Inv.&Fn, Shriram Finance, Muthoot Finance, Econo Trade Indi, FGP, Inani Securities, and BFL Asset Finves.<BR><BR>Quality Snapshot: Excellent management risk is observed at Bajaj Finance, Cholaman.Inv.&Fn, and Muthoot Finance, while Average management risk is found at Jio Financial and Shriram Finance. Good management risk is noted at BFL Asset Finves, and the rest have Below Average management risk, including Econo Trade Indi, FGP, Inani Securities, and Modern Shares. For Growth, Excellent growth is seen at Jio Financial and Econo Trade Indi, Good growth at Bajaj Finance, Cholaman.Inv.&Fn, and BFL Asset Finves, while Average growth is noted at Modern Shares, and the rest have either Below Average or Average growth. In terms of Capital Structure, Excellent capital structure is held by Bajaj Finance, Jio Financial, Shriram Finance, Muthoot Finance, and Modern Shares, while Good capital structure is at Cholaman.Inv.&Fn, and Average capital structure is found at BFL Asset Finves, with the rest having Below Average capital structure.<BR><BR>Return Snapshot: The peer with the highest 1-year return is FGP at 45.83%, while the lowest is Jio Financial at -20.19%. Modern Shares has a 1-year return of 5.33%, which is higher than Jio Financial but lower than FGP. Additionally, Econo Trade Indi and BFL Asset Finves have negative six-month returns.

View full answer

Is Modern Shares overvalued or undervalued?

09-Jun-2025

As of February 21, 2024, Modern Shares is considered very expensive and overvalued with a PE ratio of 14.07, an EV to EBIT of 1.80, and a ROCE of 40.00%, despite a strong historical return of 690.16% over five years, it has underperformed year-to-date with a 24.69% decline compared to the Sensex's 5.63% gain.

As of 21 February 2024, the valuation grade for Modern Shares has moved from expensive to very expensive, indicating a significant shift in its perceived value. The company is currently considered overvalued. Key ratios include a PE Ratio of 14.07, an EV to EBIT of 1.80, and a ROCE of 40.00%. <BR><BR>In comparison to its peers, Modern Shares has a higher PE ratio than Life Insurance, which stands at 12.54, and a similar EV to EBITDA ratio compared to Bajaj Finserv at 13.37. While Modern Shares has shown strong historical returns, including a 690.16% increase over the past five years, its recent performance has lagged behind the Sensex, with a year-to-date decline of 24.69% compared to the index's 5.63% gain.

View full answer

What is the technical trend for Modern Shares?

09-Jun-2025

As of June 6, 2025, Modern Shares exhibit a neutral trend with mixed indicators, showing a mildly bullish weekly MACD and bullish Bollinger Bands, but a mildly bearish monthly MACD and daily moving averages, reflecting market uncertainty.

As of 6 June 2025, the technical trend for Modern Shares has changed from mildly bearish to sideways. The weekly MACD indicates a mildly bullish stance, while the monthly MACD is mildly bearish, suggesting mixed signals. The Bollinger Bands are bullish on both weekly and monthly time frames, which supports a positive outlook. However, the daily moving averages are mildly bearish, indicating short-term weakness. The KST shows a mildly bullish trend weekly but is bearish monthly, and there is no clear trend according to Dow Theory on both weekly and monthly charts. Overall, the current stance is neutral with mixed indicators, reflecting uncertainty in the market.

View full answer

How big is Modern Shares?

24-Jul-2025

As of 24th July, Modern Shares & Stockbrokers Ltd has a market capitalization of 13.00 Cr, with recent net sales of 3.70 Cr and a net profit of 0.21 Cr. The balance sheet for March 2024 shows shareholder's funds of 12.57 Cr and total assets of 16.10 Cr.

As of 24th July, Modern Shares & Stockbrokers Ltd has a market capitalization of 13.00 Cr, categorizing it as a Micro Cap company.<BR><BR>In the latest four quarters, the company reported Net Sales of 3.70 Cr and a Net Profit of 0.21 Cr.<BR><BR>The latest annual period for the balance sheet is March 2024, showing Shareholder's Funds of 12.57 Cr and Total Assets of 16.10 Cr.

View full answer

When is the next results date for Modern Shares?

28-Oct-2025

The next results date for Modern Shares is November 7, 2025.

The next results date for Modern Shares is scheduled for November 7, 2025.

View full answer

Are Modern Shares latest results good or bad?

07-Nov-2025

Modern Shares' latest results are concerning, with a 7.14% year-on-year decline in net sales and a 15.79% drop in net profit, despite some improvement in operating margins. The stock is significantly underperforming, leading to a negative outlook for the company.

The latest results for Modern Shares indicate a challenging situation for the company. In the second quarter of FY26, the company reported net sales of ₹1.04 crores, which represents a 5.05% increase quarter-on-quarter but a significant decline of 7.14% year-on-year. Similarly, net profit stood at ₹0.16 crores, showing a positive sequential growth of 6.67% but a concerning drop of 15.79% compared to the same quarter last year.<BR><BR>While there was an improvement in operating margins, which rose to 25.96% from 20.20% in the previous quarter, this margin expansion was not enough to offset the overall decline in revenue and profit. The company's average return on equity (ROE) remains very low at 1.74%, indicating persistent issues with capital efficiency and shareholder value creation.<BR><BR>Additionally, the stock has been underperforming significantly, trading down 36.50% from its 52-week high and close to its 52-week low. The proprietary advisory score of just 21 out of 100 and a "Strong Sell" rating further highlight the challenges the company faces.<BR><BR>In summary, while there are some positive signs in terms of margin improvement, the overall financial performance is concerning, with declining sales and profits, leading to a negative outlook for the company.

View full answer

Should I buy, sell or hold Modern Shares?

08-Nov-2025

How has been the historical performance of Modern Shares?

09-Nov-2025

Modern Shares has shown consistent growth in net sales, reaching 3.71 Cr in March 2025, but profitability metrics declined, with profit after tax falling to 0.22 Cr. Despite this, the company improved its liquidity position, with cash and cash equivalents increasing to 12.27 Cr.

Answer:<BR>The historical performance of Modern Shares shows a gradual improvement in net sales and profitability over the years, with a notable increase in the most recent fiscal year.<BR><BR>Breakdown:<BR>Modern Shares reported net sales of 3.71 Cr in March 2025, up from 3.39 Cr in March 2024 and 2.97 Cr in March 2023, indicating a consistent upward trend in revenue. Total operating income mirrored this growth, reaching 3.71 Cr in March 2025. The company's total expenditure also increased to 3.27 Cr in March 2025 from 2.82 Cr in March 2024, yet the operating profit (PBDIT) remained positive at 0.44 Cr, although it decreased from 0.57 Cr in the previous year. Profit before tax was recorded at 0.40 Cr in March 2025, down from 0.54 Cr in March 2024, while profit after tax was 0.22 Cr, a decline from 0.40 Cr. The earnings per share (EPS) for March 2025 stood at 0.75, down from 1.37 in March 2024. The company maintained a stable book value per share of 43.46 in March 2025, reflecting a slight increase from 42.90 in March 2024. Total assets rose to 16.53 Cr in March 2025, consistent with the previous year, while total liabilities also increased slightly to 16.53 Cr. Cash and cash equivalents improved significantly to 12.27 Cr in March 2025, compared to 11.11 Cr in March 2024, indicating a stronger liquidity position. Overall, while Modern Shares has shown growth in sales and assets, there has been a decline in profitability metrics in the latest fiscal year.

View full answer

Why is Modern Shares & Stockbrokers Ltd falling/rising?

18-Jan-2026

As of 18-Jan, Modern Shares & Stockbrokers Ltd is seeing a stock price increase to 41.30, driven by short-term gains and a trend reversal. However, it faces significant long-term challenges, including a 24.35% decline over the past year and weak fundamentals.

As of 18-Jan, Modern Shares & Stockbrokers Ltd is experiencing a rise in its stock price, currently at 41.30, with a change of 0.41 (1.0%) upward. This increase can be attributed to several factors. Notably, the stock has outperformed its sector by 0.75% today and has shown a trend reversal by gaining after two consecutive days of decline. <BR><BR>In terms of recent performance, the stock has demonstrated a strong return over the past week, with an increase of 8.00%, while the benchmark Sensex has remained nearly flat at -0.01%. Additionally, the stock has performed well over the past month, with a rise of 2.74%, contrasting with the Sensex's decline of 1.31%. Year-to-date, the stock is up 4.50%, while the Sensex has fallen by 1.94%. <BR><BR>However, it is important to note that despite the recent rise, the stock has significant long-term challenges. Over the past year, it has underperformed the market with a decline of 24.35%, while the broader market has gained 8.47%. The company's fundamentals are weak, as indicated by a low average Return on Equity (ROE) of 2.30% and a concerning growth rate in net sales of only 9.44% annually. <BR><BR>In summary, while Modern Shares & Stockbrokers Ltd is currently rising due to short-term performance metrics and a recent trend reversal, it faces substantial long-term challenges that could impact its future performance.

View full answer
iScoreScore
Click here to find our call on this stock
Strong Sell
Sell
Hold
Buy
Strong Buy

MarketsMojo — Loved in India, Now Global

The power of Mojo is now in 29 countries. Explore global equities with the same cutting-edge features you love.

Dashboard

1

Weak Long Term Fundamental Strength with an average Return on Equity (ROE) of 2.30%

  • Poor long term growth as Net Sales has grown by an annual rate of 9.44%
2

Flat results in Sep 25

 
3

With ROE of 1.9, it has a Very Expensive valuation with a 0.9 Price to Book Value

4

Underperformed the market in the last 1 year

stock-summaryMojo Parameters

Mojo Parameters

Loading Valuation Snapshot...

Stock DNA

stock-summary
Industry

Non Banking Financial Company (NBFC)

stock-summary
Market cap

INR 12 Cr (Micro Cap)

stock-summary
P/E

48.00

stock-summary
Industry P/E

23

stock-summary
Dividend Yield

0.00%

stock-summary
Debt Equity

0.00

stock-summary
Return on Equity

1.92%

stock-summary
Price to Book

0.93

Revenue and Profits:
Net Sales:
1 Cr
(Quarterly Results - Sep 2025)
Net Profit:
0 Cr
stock-summaryTotal Returns
Total Returns (Price + Dividend) stock-summary
Dividend Yield (0%)
TimePeriod
Price Return
Dividend Return
Total Return
3 Months
-3.27%
0%
-3.27%
6 Months
-8.74%
0%
-8.74%
1 Year
-26.69%
0%
-26.69%
2 Years
42.75%
0%
42.75%
3 Years
112.61%
0%
112.61%
4 Years
112.61%
0%
112.61%
5 Years
683.73%
0%
683.73%

Latest dividend: 0.5 per share ex-dividend date: Jul-24-2018

Risk Adjusted Returns v/s stock-summary
Returns Beta
Icon
Beta has not been calculated since enough price history is not available
stock-summaryNews & Corporate Actions

News

Why is Modern Shares & Stockbrokers Ltd falling/rising?

Recent Price Movement and Market Context

The stock opened with a gap up of 2.48% on 12-Jan, signalling renewed buying interest early in the trading session. It further extended gains to touch an intraday high of ₹41.45, representing an 8.39% increase from the previous close. This intraday strength underscores a positive shift in investor sentiment after a brief period of consecutive falls. Despite this rally, the weighted average price indicates that a larger volume of shares traded closer to the lower end of the day’s price range, suggesting some caution among participants.

Comparing the stock’s recent performance against the Sensex reveals a mixed but generally favourable trend. Over the past week, Modern Shares & Stockbrokers Ltd gained 1.71%, while the Sensex d...

Read full news article
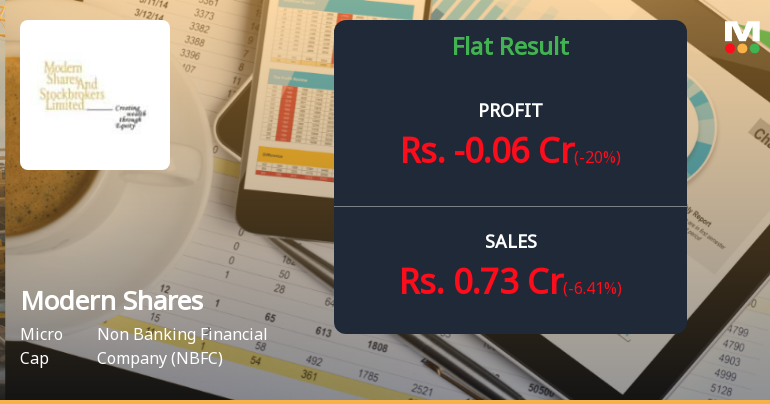
Announcements stock-summary

Board Meeting Intimation for The Estimated (Provisional) Un-Audited Results For The 3Rd Quarter Ended December 31 2025

12-Jan-2026 | Source : BSE

Modern Shares & Stockbrokers Ltdhas informed BSE that the meeting of the Board of Directors of the Company is scheduled on 30/01/2026 inter alia to consider and approve the estimated (provisional) un-audited results for the 3rd Quarter ended December 31 2025. The notice has been issued pursuant to Regulation 29(1) (a) & 29(2) of the Listing Regulations. Please note that as informed in our letter dated January 2 2026 the Trading Window has been closed from Friday January 2 2026 and the said window shall open 48 hours after the outcome of the aforesaid meeting is made public.

Compliances-Certificate under Reg. 74 (5) of SEBI (DP) Regulations 2018

05-Jan-2026 | Source : BSE

Enclosed the certificated dated January 5 2026 issued by MUFG Intime India Pvt Ltd Registrar and transfer agent of our company confirming the compliance of regulation 74 (5).

Submission Under SEBI Circular SEBI/HO/DDHS/CIR/P/2018/144 Dated November 26 2018 Regarding Submitting Of Initial Disclosure/Confirmation Within Prescribed Due Date

02-Jan-2026 | Source : BSE

Our company is not falling in the criteria prescribed under clause 2.2 of the aforesaid circular thus we are not Large Corporates and the company has no debt securities and the framework is not applicable for our company.

Corporate Actions stock-summary

stock-summary
BOARD MEETING

30 Jan 2026

stock-summary
DIVIDEND

Modern Shares & Stockbrokers Ltd has declared 5% dividend, ex-date: 24 Jul 18

stock-summary
SPLITS

No Splits history available

stock-summary
BONUS

No Bonus history available

stock-summary
RIGHTS

No Rights history available

stock-summaryKey Factors

Quality key factors stock-summary

Factor
Value
Sales Growth (5y)
9.44%
EBIT Growth (5y)
11.59%
Net Debt to Equity (avg)
0
Institutional Holding
0
ROE (avg)
2.30%

Valuation key factors

Factor
Value
P/E Ratio
48
Industry P/E
23
Price to Book Value
0.93
EV to EBIT
0.21
EV to EBITDA
0.21
EV to Capital Employed
0.19
EV to Sales
0.06
PEG Ratio
NA
Dividend Yield
NA
ROCE (Latest)
44.14%
ROE (Latest)
1.92%

Technicals key factors

Indicator
Weekly
Monthly
MACD
Bearish
Mildly Bearish
RSI
Bullish
No Signal
Bollinger Bands
Mildly Bearish
Mildly Bearish
Moving Averages
Bearish (Daily)
KST
Bearish
Mildly Bearish
Dow Theory
No Trend
Mildly Bearish
stock-summary Technical Indicator Scale: Bearish, Mildly Bearish, Sideways, Mildly Bullish, Bullish  Turned 
stock-summaryShareholding
Shareholding Snapshot : Dec 2025stock-summary
Shareholding Compare (%holding) stock-summary
Majority shareholders

Promoters

Pledged Promoter Holdings

None

Mutual Funds

Held by 0 Schemes

FIIs

Held by 0 FIIs

Promoter with highest holding

Bhagwanti Exports Private Limited (36.68%)

Highest Public shareholder

Kamal Ramesh Dhanwani (3.41%)

Individual Investors Holdings

14.36%

stock-summaryFinancial
[
  {
    "link": "quarterly",
    "btn_text": "All Quarterly Results",
    "header": "Quarterly Results Snapshot (Standalone) - Sep'25 - YoY",
    "rhs": [
      {
        "prefix": "Net Sales ",
        "suffix": "YoY Growth in quarter ended Sep 2025 is -7.14% vs 27.27% in Sep 2024",
        "dir": -1
      },
      {
        "prefix": "Standalone Net Profit ",
        "suffix": "YoY Growth in quarter ended Sep 2025 is -15.79% vs 18.75% in Sep 2024",
        "dir": -1
      }
    ],
    "table": {
      "header": [
        "Sep'25",
        "Sep'24",
        "Change(%)"
      ],
      "body": [
        {
          "field": "Net Sales",
          "val1": "1.04",
          "val2": "1.12",
          "chgp": "-7.14%",
          "chgp_class": "negative"
        },
        {
          "field": "Operating Profit (PBDIT) excl Other Income",
          "val1": "0.27",
          "val2": "0.27",
          "chgp": "",
          "chgp_class": "neutral"
        },
        {
          "field": "Interest",
          "val1": "0.01",
          "val2": "0.00",
          "chgp": "",
          "chgp_class": "neutral"
        },
        {
          "field": "Exceptional Items",
          "val1": "0.00",
          "val2": "0.00",
          "chgp": "",
          "chgp_class": "neutral"
        },
        {
          "field": "Standalone Net Profit",
          "val1": "0.16",
          "val2": "0.19",
          "chgp": "-15.79%",
          "chgp_class": "negative"
        },
        {
          "field": "Operating Profit Margin (Excl OI)",
          "val1": "25.96%",
          "val2": "24.11%",
          "chgp": "1.85%",
          "chgp_class": "positive"
        }
      ]
    }
  },
  {
    "link": "half-yearly",
    "btn_text": "All Half Yearly Results",
    "header": "Half Yearly Results Snapshot (Standalone) - Sep'25",
    "rhs": [
      {
        "prefix": "Net Sales ",
        "suffix": " Growth in half year ended Sep 2025 is 1.00% vs 25.62% in Sep 2024",
        "dir": -1
      },
      {
        "prefix": "Standalone Net Profit ",
        "suffix": " Growth in half year ended Sep 2025 is 10.71% vs 33.33% in Sep 2024",
        "dir": -1
      }
    ],
    "table": {
      "header": [
        "Sep'25",
        "Sep'24",
        "Change(%)"
      ],
      "body": [
        {
          "field": "Net Sales",
          "val1": "2.03",
          "val2": "2.01",
          "chgp": "1.00%",
          "chgp_class": "positive"
        },
        {
          "field": "Operating Profit (PBDIT) excl Other Income",
          "val1": "0.46",
          "val2": "0.38",
          "chgp": "21.05%",
          "chgp_class": "positive"
        },
        {
          "field": "Interest",
          "val1": "0.01",
          "val2": "0.01",
          "chgp": "",
          "chgp_class": "neutral"
        },
        {
          "field": "Exceptional Items",
          "val1": "0.00",
          "val2": "0.00",
          "chgp": "",
          "chgp_class": "neutral"
        },
        {
          "field": "Standalone Net Profit",
          "val1": "0.31",
          "val2": "0.28",
          "chgp": "10.71%",
          "chgp_class": "positive"
        },
        {
          "field": "Operating Profit Margin (Excl OI)",
          "val1": "22.66%",
          "val2": "18.91%",
          "chgp": "3.75%",
          "chgp_class": "positive"
        }
      ]
    }
  },
  {
    "link": "nine-monthly",
    "btn_text": "All Nine Monthly Results",
    "header": "Nine Monthly Results Snapshot (Standalone) - Dec'24",
    "rhs": [
      {
        "prefix": "Net Sales ",
        "suffix": "YoY Growth in nine months ended Dec 2024 is 19.18% vs 3.81% in Dec 2023",
        "dir": 1
      },
      {
        "prefix": "Standalone Net Profit ",
        "suffix": "YoY Growth in nine months ended Dec 2024 is -10.00% vs 87.50% in Dec 2023",
        "dir": -1
      }
    ],
    "table": {
      "header": [
        "Dec'24",
        "Dec'23",
        "Change(%)"
      ],
      "body": [
        {
          "field": "Net Sales",
          "val1": "2.92",
          "val2": "2.45",
          "chgp": "19.18%",
          "chgp_class": "positive"
        },
        {
          "field": "Operating Profit (PBDIT) excl Other Income",
          "val1": "0.42",
          "val2": "0.43",
          "chgp": "-2.33%",
          "chgp_class": "negative"
        },
        {
          "field": "Interest",
          "val1": "0.02",
          "val2": "0.01",
          "chgp": "100.00%",
          "chgp_class": "negative"
        },
        {
          "field": "Exceptional Items",
          "val1": "0.00",
          "val2": "0.00",
          "chgp": "",
          "chgp_class": "neutral"
        },
        {
          "field": "Standalone Net Profit",
          "val1": "0.27",
          "val2": "0.30",
          "chgp": "-10.00%",
          "chgp_class": "negative"
        },
        {
          "field": "Operating Profit Margin (Excl OI)",
          "val1": "14.38%",
          "val2": "17.55%",
          "chgp": "-3.17%",
          "chgp_class": "negative"
        }
      ]
    }
  },
  {
    "link": "annual",
    "btn_text": "All Annual Results",
    "header": "Annual Results Snapshot (Standalone) - Mar'25",
    "rhs": [
      {
        "prefix": "Net Sales ",
        "suffix": "YoY Growth in year ended Mar 2025 is 9.44% vs 14.14% in Mar 2024",
        "dir": -1
      },
      {
        "prefix": "Standalone Net Profit ",
        "suffix": "YoY Growth in year ended Mar 2025 is -45.00% vs 166.67% in Mar 2024",
        "dir": -1
      }
    ],
    "table": {
      "header": [
        "Mar'25",
        "Mar'24",
        "Change(%)"
      ],
      "body": [
        {
          "field": "Net Sales",
          "val1": "3.71",
          "val2": "3.39",
          "chgp": "9.44%",
          "chgp_class": "positive"
        },
        {
          "field": "Operating Profit (PBDIT) excl Other Income",
          "val1": "0.44",
          "val2": "0.57",
          "chgp": "-22.81%",
          "chgp_class": "negative"
        },
        {
          "field": "Interest",
          "val1": "0.01",
          "val2": "0.02",
          "chgp": "-50.00%",
          "chgp_class": "positive"
        },
        {
          "field": "Exceptional Items",
          "val1": "0.00",
          "val2": "0.00",
          "chgp": "",
          "chgp_class": "neutral"
        },
        {
          "field": "Standalone Net Profit",
          "val1": "0.22",
          "val2": "0.40",
          "chgp": "-45.00%",
          "chgp_class": "negative"
        },
        {
          "field": "Operating Profit Margin (Excl OI)",
          "val1": "11.86%",
          "val2": "16.81%",
          "chgp": "-4.95%",
          "chgp_class": "negative"
        }
      ]
    }
  }
]

Quarterly Results Snapshot (Standalone) - Sep'25 - YoYstock-summary

Sep'25
Sep'24
Change(%)
Net Sales
1.04
1.12
-7.14%
Operating Profit (PBDIT) excl Other Income
0.27
0.27
Interest
0.01
0.00
Exceptional Items
0.00
0.00
Standalone Net Profit
0.16
0.19
-15.79%
Operating Profit Margin (Excl OI)
25.96%
24.11%
1.85%
Values in Rs Cr.
Direction Arrows
Net Sales

YoY Growth in quarter ended Sep 2025 is -7.14% vs 27.27% in Sep 2024

Direction Arrows
Standalone Net Profit

YoY Growth in quarter ended Sep 2025 is -15.79% vs 18.75% in Sep 2024

Half Yearly Results Snapshot (Standalone) - Sep'25stock-summary

Sep'25
Sep'24
Change(%)
Net Sales
2.03
2.01
1.00%
Operating Profit (PBDIT) excl Other Income
0.46
0.38
21.05%
Interest
0.01
0.01
Exceptional Items
0.00
0.00
Standalone Net Profit
0.31
0.28
10.71%
Operating Profit Margin (Excl OI)
22.66%
18.91%
3.75%
Values in Rs Cr.
Direction Arrows
Net Sales

Growth in half year ended Sep 2025 is 1.00% vs 25.62% in Sep 2024

Direction Arrows
Standalone Net Profit

Growth in half year ended Sep 2025 is 10.71% vs 33.33% in Sep 2024

Nine Monthly Results Snapshot (Standalone) - Dec'24stock-summary

Dec'24
Dec'23
Change(%)
Net Sales
2.92
2.45
19.18%
Operating Profit (PBDIT) excl Other Income
0.42
0.43
-2.33%
Interest
0.02
0.01
100.00%
Exceptional Items
0.00
0.00
Standalone Net Profit
0.27
0.30
-10.00%
Operating Profit Margin (Excl OI)
14.38%
17.55%
-3.17%
Values in Rs Cr.
Direction Arrows
Net Sales

YoY Growth in nine months ended Dec 2024 is 19.18% vs 3.81% in Dec 2023

Direction Arrows
Standalone Net Profit

YoY Growth in nine months ended Dec 2024 is -10.00% vs 87.50% in Dec 2023

Annual Results Snapshot (Standalone) - Mar'25stock-summary

Mar'25
Mar'24
Change(%)
Net Sales
3.71
3.39
9.44%
Operating Profit (PBDIT) excl Other Income
0.44
0.57
-22.81%
Interest
0.01
0.02
-50.00%
Exceptional Items
0.00
0.00
Standalone Net Profit
0.22
0.40
-45.00%
Operating Profit Margin (Excl OI)
11.86%
16.81%
-4.95%
Values in Rs Cr.
Direction Arrows
Net Sales

YoY Growth in year ended Mar 2025 is 9.44% vs 14.14% in Mar 2024

Direction Arrows
Standalone Net Profit

YoY Growth in year ended Mar 2025 is -45.00% vs 166.67% in Mar 2024

stock-summaryCompany CV
About Modern Shares & Stockbrokers Ltd stock-summary
stock-summary
Modern Shares & Stockbrokers Ltd
Micro Cap
Non Banking Financial Company (NBFC)
Modern Shares & Stockbrokers Ltd., formerly known as Modern Home Credit & Capital Limited (MHCCL), was established as a private limited company on 1st Jul.'39 and subsequently converted into a public limited company on 20th Nov.'70. The Company is primarily engaged in stock broking. Presently rechristened Modern Shares & Stockbrokers Ltd, (MSSL) is engaged in fund based activities like Investments, Inter Corporate Deposits, Bills Discounting, Leasing, Loans Syndication etc.
Company Coordinates stock-summary
Company Details
Wankhede Stadium North Stand, Staircase No 13 D Rd Churchgat Mumbai Maharashtra : 400020
stock-summary
Tel: 91-22-42122400
stock-summary
modernshares@hotmail.com
Registrar Details
Link Intime India Pvt Ltd, C-13 Pannalal Silk Compound, L B S Marg, Bhandup , Mumbai