
Compare Morgan Ventures with Similar Stocks
Stock DNA
Non Banking Financial Company (NBFC)
INR 49 Cr (Micro Cap)
12.00
20
0.00%
2.10
4.44%
0.53
Total Returns (Price + Dividend) 
Morgan Ventures for the last several years.
Risk Adjusted Returns v/s
Returns Beta

News
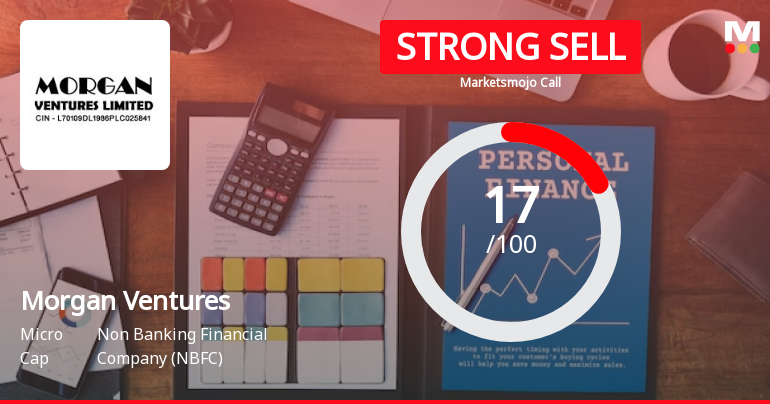
Morgan Ventures Ltd is Rated Strong Sell
Morgan Ventures Ltd is rated Strong Sell by MarketsMOJO. This rating was last updated on 12 Sep 2025. However, the analysis and financial metrics presented here reflect the stock’s current position as of 04 June 2026, providing investors with the latest insights into the company’s performance and outlook.
Read full news article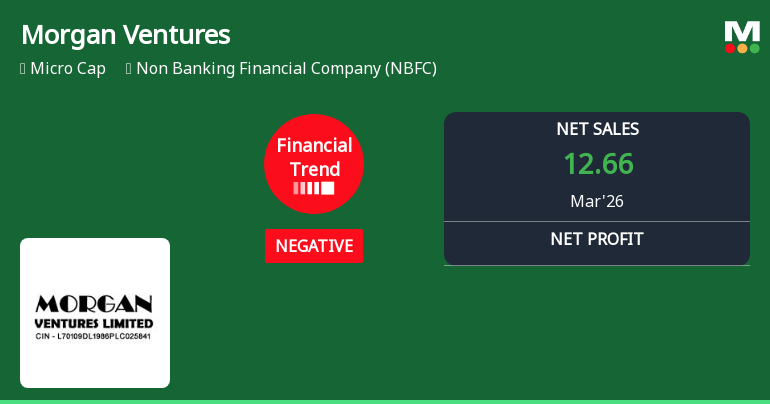
Morgan Ventures Ltd Reports Mixed Quarterly Results Amid Ongoing Financial Challenges
Morgan Ventures Ltd, a micro-cap player in the Non Banking Financial Company (NBFC) sector, has posted a mixed quarterly performance for March 2026, reflecting a slight improvement in financial trend scores but continued pressure on key profitability metrics. Despite a modest uptick in its financial trend parameter, the company’s revenue and profit figures remain subdued compared to historical levels, signalling ongoing challenges in its operational environment.
Read full news article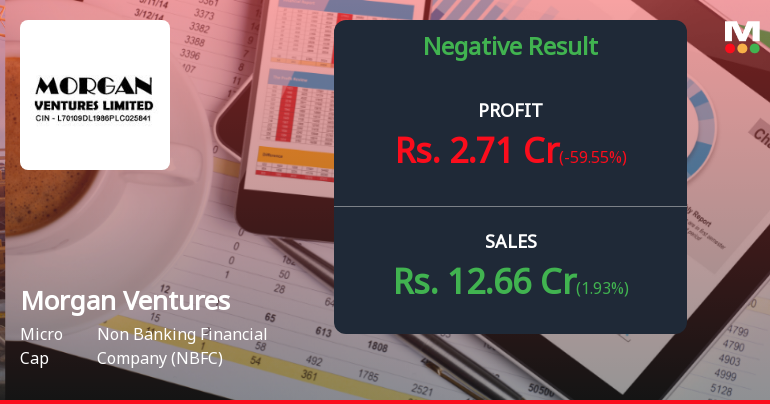
Morgan Ventures Q4 FY26: Profitability Rebounds But Volatility Raises Concerns
Morgan Ventures Ltd., a micro-cap non-banking financial company (NBFC), posted a net profit of ₹2.71 crores in Q4 FY26 (Mar'26), marking a dramatic recovery from the ₹5.13 crore loss reported in the previous quarter. However, this represents a sharp 59.70% year-on-year decline from ₹6.73 crores in Q4 FY25, underscoring the extreme volatility that has characterised the company's recent performance. The stock, currently trading at ₹50.99 with a market capitalisation of ₹50.47 crores, remains under pressure, down 49.46% over the past year and significantly underperforming its NBFC sector peers.
Read full news article Announcements
Announcement under Regulation 30 (LODR)-Newspaper Publication
30-May-2026 | Source : BSENewspaper Publication
Announcement under Regulation 30 (LODR)-Change in Directorate
29-May-2026 | Source : BSEReappointment of Mr. Sanjiv Bansal as Independent Director for Second Term of 5 Years w.e.f. June 17 2026
Announcement under Regulation 30 (LODR)-Change in Management
29-May-2026 | Source : BSEReappointment of Mr. Sanjiv Bansal as Independent Director for Second Term of 5 years w.e.f. June 17 2026.
Corporate Actions

No Upcoming Board Meetings

No Dividend history available

No Splits history available

No Bonus history available

No Rights history available
Quality key factors
Valuation key factors
Technicals key factors
 Technical Indicator Scale: Bearish, Mildly Bearish, Sideways, Mildly Bullish, Bullish Turned
 Shareholding Snapshot : Mar 2026
Shareholding Compare (%holding)
Promoters
None
Held by 0 Schemes
Held by 0 FIIs
Poysha Oxygen Private Limited (20.57%)
Crb Capital Markets Limited (2.01%)
17.49%
Quarterly Results Snapshot (Standalone) - Mar'26 - YoY

YoY Growth in quarter ended Mar 2026 is 1.93% vs 13.84% in Mar 2025
YoY Growth in quarter ended Mar 2026 is -59.55% vs 39.29% in Mar 2025
Half Yearly Results Snapshot (Standalone) - Sep'25
Growth in half year ended Sep 2025 is 6.04% vs 144.28% in Sep 2024
Growth in half year ended Sep 2025 is -33.78% vs 218.48% in Sep 2024
Nine Monthly Results Snapshot (Standalone) - Dec'25
YoY Growth in nine months ended Dec 2025 is -36.73% vs 171.77% in Dec 2024
YoY Growth in nine months ended Dec 2025 is -92.72% vs 285.02% in Dec 2024
Annual Results Snapshot (Standalone) - Mar'26
YoY Growth in year ended Mar 2026 is -32.35% vs 96.91% in Mar 2025
YoY Growth in year ended Mar 2026 is -83.84% vs 157.49% in Mar 2025
About Morgan Ventures Ltd

Company Coordinates


