
Compare MTAR Technologie with Similar Stocks
Dashboard
Strong ability to service debt as the company has a low Debt to EBITDA ratio of 2.20 times
Poor long term growth as Operating profit has grown by an annual rate 14.07% of over the last 5 years
With a growth in Net Profit of 27.64%, the company declared Very Positive results in Mar 26
With ROCE of 14.1, it has a Very Expensive valuation with a 17.6 Enterprise value to Capital Employed
Reducing Promoter Confidence
Stock DNA
Aerospace & Defense
INR 15,943 Cr (Small Cap)
173.00
35
0.00%
0.17
11.78%
20.40
Total Returns (Price + Dividend) 
Latest dividend: 2.988588196935116 per share ex-dividend date: Feb-21-2022
Risk Adjusted Returns v/s
Returns Beta

News
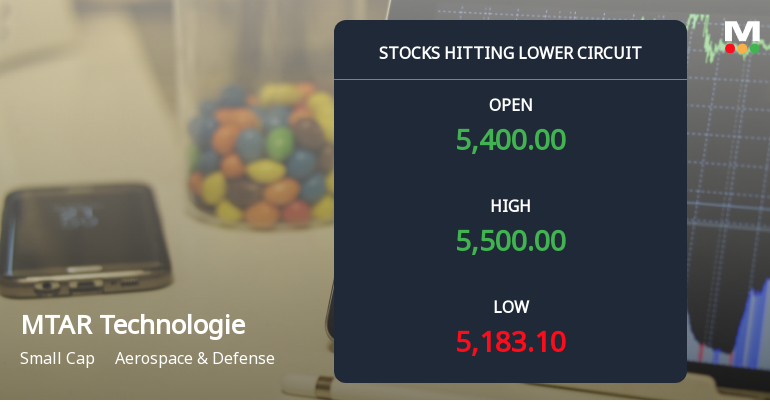
MTAR Technologies Ltd Locks at Lower Circuit With 5.0% Loss — Sellers Queue, No Buyers in Sight
At Rs 5,194, sellers were still queuing — but there were no buyers willing to take the other side. MTAR Technologies Ltd locked at its lower circuit of 5.0% on 29 Jul 2026, with unfilled sell orders and a frozen price, signalling a day dominated by supply overwhelming demand.
Read full news article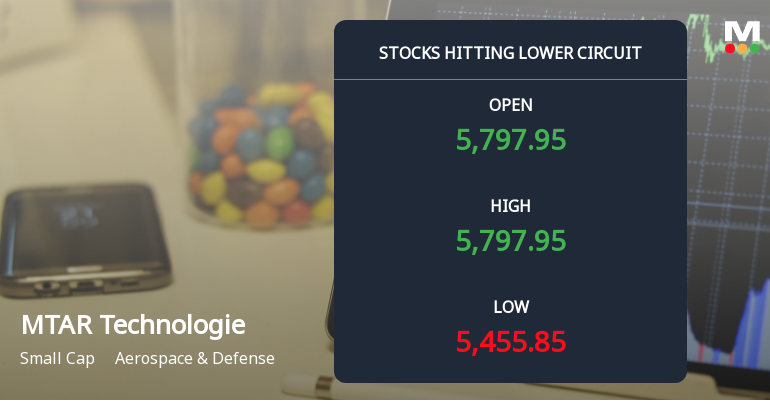
MTAR Technologies Ltd Locks at Lower Circuit With 4.96% Loss — Sellers Queue, No Buyers in Sight
At Rs 5,469, sellers were still queuing — but there were no buyers willing to take the other side. MTAR Technologies Ltd locked at its lower circuit of 4.96% on 28 Jul 2026, with unfilled sell orders and a frozen price.
Read full news article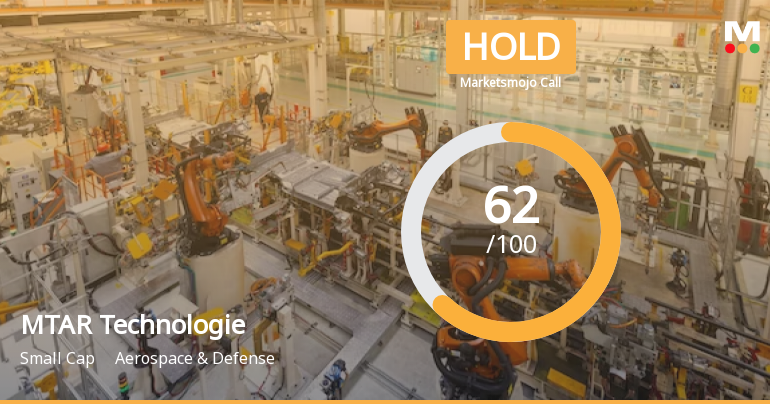
MTAR Technologies Ltd is Rated Hold by MarketsMOJO
MTAR Technologies Ltd is rated 'Hold' by MarketsMOJO, with this rating last updated on 03 July 2026. However, the analysis and financial metrics discussed here reflect the company’s current position as of 28 July 2026, providing investors with an up-to-date view of the stock’s fundamentals, valuation, financial trends, and technical outlook.
Read full news article Announcements
Announcement under Regulation 30 (LODR)-Analyst / Investor Meet - Intimation
24-Jul-2026 | Source : BSEEarnings Call on 30.07.2026
Board Meeting Intimation for Un-Audited Financial Results For The Quarter Ended 30.06.2026
23-Jul-2026 | Source : BSEMTAR Technologies Ltdhas informed BSE that the meeting of the Board of Directors of the Company is scheduled on 29/07/2026 inter alia to consider and approve Un-audited Financial Results for the quarter ended 30.06.2026
Compliance As Per Regulation 74 (5) Of The SEBI (Depositories And Participants) Regulations 2018 For The Quarter Ended 30Th June 2026.
15-Jul-2026 | Source : BSECompliance Certificate under Regulation 74 (5) of SEBI (DP) Regulations 2018
Corporate Actions

(29 Jul 2026)

MTAR Technologies Ltd has declared 30% dividend, ex-date: 21 Feb 22

No Splits history available

No Bonus history available

No Rights history available
Quality key factors
Valuation key factors
Technicals key factors
 Technical Indicator Scale: Bearish, Mildly Bearish, Sideways, Mildly Bullish, Bullish Turned
 Shareholding Snapshot : Jun 2026
Shareholding Compare (%holding)
Promoters
3.5217
Held by 23 Schemes (20.36%)
Held by 230 FIIs (24.79%)
K Vamshidhar Reddy (5.71%)
Nippon Life India Trustee Ltd- A/c Nippon India Gr (4.29%)
20.61%
Quarterly Results Snapshot (Consolidated) - Mar'26 - QoQ

QoQ Growth in quarter ended Mar 2026 is 10.11% vs 105.00% in Dec 2025
QoQ Growth in quarter ended Mar 2026 is 27.64% vs 716.24% in Dec 2025
Half Yearly Results Snapshot (Consolidated) - Sep'25
Growth in half year ended Sep 2025 is -8.25% vs -0.30% in Sep 2024

Growth in half year ended Sep 2025 is -35.09% vs -43.14% in Sep 2024
Nine Monthly Results Snapshot (Consolidated) - Dec'25
YoY Growth in nine months ended Dec 2025 is 15.67% vs 12.59% in Dec 2024
YoY Growth in nine months ended Dec 2025 is 27.04% vs -23.59% in Dec 2024
Annual Results Snapshot (Consolidated) - Mar'26
YoY Growth in year ended Mar 2026 is 29.62% vs 16.40% in Mar 2025
YoY Growth in year ended Mar 2026 is 77.78% vs -5.74% in Mar 2025
About MTAR Technologies Ltd

Company Coordinates


