
Compare MTAR Technologie with Similar Stocks
Stock DNA
Aerospace & Defense
INR 23,734 Cr (Small Cap)
234.00
36
0.00%
0.17
11.78%
27.51
Total Returns (Price + Dividend) 
Latest dividend: 2.988588196935116 per share ex-dividend date: Feb-21-2022
Risk Adjusted Returns v/s
Returns Beta

News

MTAR Technologies Ltd Sees Robust Trading Activity Amid Strong Institutional Interest
MTAR Technologies Ltd (MTARTECH) has emerged as one of the most actively traded stocks by value on 16 June 2026, reflecting heightened investor interest following a recent upgrade in its Mojo Grade to 'Buy'. The aerospace and defence company recorded a total traded value exceeding ₹443 crore, supported by strong volume and sustained price gains, signalling robust market confidence in its growth prospects.
Read full news article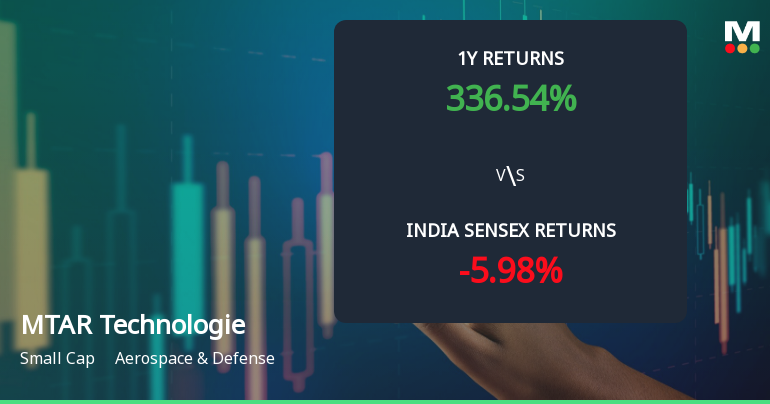
MTAR Technologies Ltd Sees Bullish Momentum Shift Amid Strong Technical Signals
MTAR Technologies Ltd has experienced a notable shift in price momentum, with technical indicators signalling a transition from mildly bullish to a more confident bullish trend. The company’s stock price has surged by 2.73% in the latest session, reflecting growing investor optimism supported by robust technical parameters across multiple timeframes.
Read full news article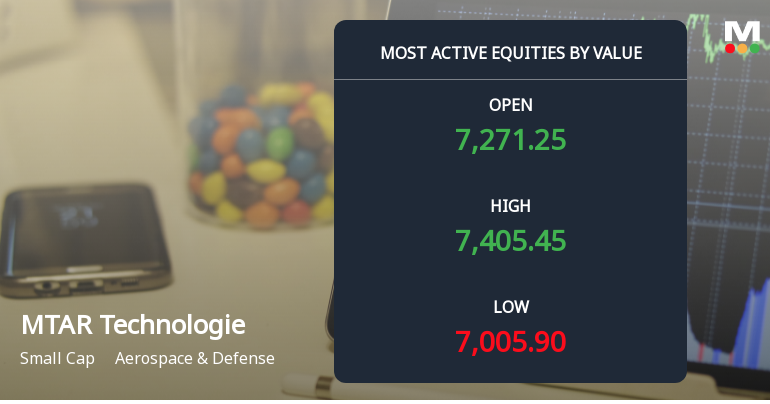
MTAR Technologies Ltd Sees High-Value Trading Amid Mixed Market Signals
MTAR Technologies Ltd, a small-cap player in the Aerospace & Defence sector, witnessed significant trading activity on 15 June 2026, with a total traded value exceeding ₹463 crores. Despite this robust turnover, the stock underperformed its sector and broader market indices, reflecting a complex interplay of investor sentiment and technical factors.
Read full news article Announcements
Rumour verification - Regulation 30(11)
12-Jun-2026 | Source : BSEReply to the BSEs mail dated 12.06.2026 regarding Rumour Verification
Clarification sought from MTAR Technologies Ltd
12-Jun-2026 | Source : BSEThe Exchange has sought clarification from MTAR Technologies Ltd on June 12 2026 with reference to news appeared in https://www.cnbctv18.com dated June 12 2026 quoting MTAR Tech rebounds 10% on Bloom Energy project clarity; Heres what the management said
The reply is awaited.
Announcement under Regulation 30 (LODR)-Analyst / Investor Meet - Intimation
08-Jun-2026 | Source : BSEIntimation of Schedule of Analyst / Institutional Investor meetings and plant visit
Corporate Actions

No Upcoming Board Meetings

MTAR Technologies Ltd has declared 30% dividend, ex-date: 21 Feb 22

No Splits history available

No Bonus history available

No Rights history available
Quality key factors
Valuation key factors
Technicals key factors
 Technical Indicator Scale: Bearish, Mildly Bearish, Sideways, Mildly Bullish, Bullish Turned
 Shareholding Snapshot : Mar 2026
Shareholding Compare (%holding)
Promoters
8.9378
Held by 21 Schemes (23.49%)
Held by 161 FIIs (17.31%)
K Vamshidhar Reddy (6.03%)
Nippon Life India Trustee Ltd-a/c Nippon India Sma (5.82%)
21.01%
Quarterly Results Snapshot (Consolidated) - Mar'26 - QoQ

QoQ Growth in quarter ended Mar 2026 is 10.11% vs 105.00% in Dec 2025
QoQ Growth in quarter ended Mar 2026 is 27.64% vs 716.24% in Dec 2025
Half Yearly Results Snapshot (Consolidated) - Sep'25
Growth in half year ended Sep 2025 is -8.25% vs -0.30% in Sep 2024

Growth in half year ended Sep 2025 is -35.09% vs -43.14% in Sep 2024
Nine Monthly Results Snapshot (Consolidated) - Dec'25
YoY Growth in nine months ended Dec 2025 is 15.67% vs 12.59% in Dec 2024
YoY Growth in nine months ended Dec 2025 is 27.04% vs -23.59% in Dec 2024
Annual Results Snapshot (Consolidated) - Mar'26
YoY Growth in year ended Mar 2026 is 29.62% vs 16.40% in Mar 2025
YoY Growth in year ended Mar 2026 is 77.78% vs -5.74% in Mar 2025
About MTAR Technologies Ltd

Company Coordinates


