
Compare Mufin Green with Similar Stocks
Dashboard
Strong Long Term Fundamental Strength with a 47.13% CAGR growth in Operating Profits
Healthy long term growth as Net Sales has grown by an annual rate of 56.89% and Operating profit at 47.13%
With a growth in Net Profit of 58.2%, the company declared Very Positive results in Mar 26
With ROE of 4.8, it has a Fair valuation with a 4 Price to Book Value
Increasing Participation by Institutional Investors
Stock DNA
Non Banking Financial Company (NBFC)
INR 2,256 Cr (Micro Cap)
83.00
21
0.00%
2.43
4.76%
3.85
Total Returns (Price + Dividend) 
Latest dividend: 0.033 per share ex-dividend date: Sep-20-2022
Risk Adjusted Returns v/s
Returns Beta

News

Broad-Based Technical Strength Lifts Mufin Green Finance Ltd to 52-Week High of Rs 133.05
Surging to an intraday peak of Rs 133.05 on 19 Jun 2026, Mufin Green Finance Ltd has marked a significant milestone by reaching a fresh 52-week high. This achievement caps an impressive 86.82% rally over the past year, substantially outperforming the Sensex’s decline of 5.77% during the same period.
Read full news article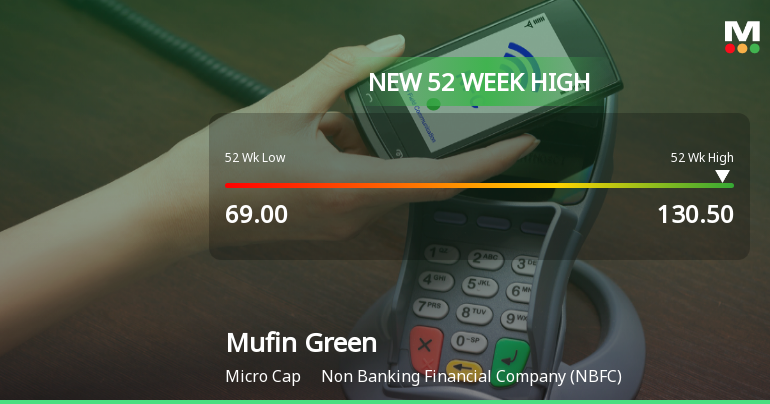
Broad-Based Technical Strength Lifts Mufin Green Finance Ltd to 52-Week High of Rs 130.5
With a sustained rally pushing Mufin Green Finance Ltd to a new 52-week high of Rs 130.5 on 18 Jun 2026, the stock has demonstrated remarkable momentum, outpacing the broader market and its sector peers.
Read full news article
Broad-Based Technical Strength Lifts Mufin Green Finance Ltd to 52-Week High of Rs 129
Surging to an intraday peak of Rs 129 on 17 Jun 2026, Mufin Green Finance Ltd has marked a significant milestone by hitting a fresh 52-week high. This rally reflects a powerful confluence of technical momentum and sustained price strength, with the stock outperforming its sector and broader market indices over the past year.
Read full news article Announcements
Intimation For Participation In The Analysts And Investors Meet- Pursuant To Regulation 30 Of Securities And Exchange Board Of India (Listing Obligations And Disclosure Requirements) Regulations 2015
19-Jun-2026 | Source : BSEPlease find the attached intimation for Participation in the Analysts and Investor Meet.
Announcement under Regulation 30 (LODR)-Allotment
15-Jun-2026 | Source : BSEPlease find the attached intimation for Allotment of Non Convertible Debentures
Announcement under Regulation 30 (LODR)-Allotment
09-Jun-2026 | Source : BSEPlease find the attached intimation for allotment of Non Convertible Debenture
Corporate Actions

No Upcoming Board Meetings

Mufin Green Finance Ltd has declared 10% dividend, ex-date: 20 Sep 22

Mufin Green Finance Ltd has announced 1:2 stock split, ex-date: 13 Apr 23

Mufin Green Finance Ltd has announced 2:1 bonus issue, ex-date: 07 Jul 23

No Rights history available
Quality key factors
Valuation key factors
Technicals key factors
 Technical Indicator Scale: Bearish, Mildly Bearish, Sideways, Mildly Bullish, Bullish Turned
 Shareholding Snapshot : Mar 2026
Shareholding Compare (%holding)
Promoters
None
Held by 0 Schemes
Held by 12 FIIs (1.18%)
Hindon Mercantile Limited (44.53%)
Incofin India Progress Fund (7.31%)
27.87%
Quarterly Results Snapshot (Consolidated) - Mar'26 - QoQ

QoQ Growth in quarter ended Mar 2026 is 22.12% vs -0.99% in Dec 2025
QoQ Growth in quarter ended Mar 2026 is 58.20% vs 21.91% in Dec 2025
Half Yearly Results Snapshot (Standalone) - Sep'25

Growth in half year ended Sep 2025 is 27.46% vs 99.77% in Sep 2024
Growth in half year ended Sep 2025 is -1.55% vs 38.47% in Sep 2024
Nine Monthly Results Snapshot (Standalone) - Dec'25
YoY Growth in nine months ended Dec 2025 is 25.45% vs 82.96% in Dec 2024
YoY Growth in nine months ended Dec 2025 is 4.82% vs 36.47% in Dec 2024
Annual Results Snapshot (Consolidated) - Mar'26
YoY Growth in year ended Mar 2026 is 15.95% vs 85.45% in Mar 2025
YoY Growth in year ended Mar 2026 is 44.11% vs 22.10% in Mar 2025
About Mufin Green Finance Ltd

Company Coordinates


