
Compare Muthoot Cap.Serv with Similar Stocks
Dashboard
Weak Long Term Fundamental Strength with an average Return on Equity (ROE) of 4.59%
- Poor long term growth as Net Sales has grown by an annual rate of 4.23% and Operating profit at 5.32%
With ROE of 1.9, it has a Expensive valuation with a 0.5 Price to Book Value
80.53% of Promoter Shares are Pledged
Consistent Underperformance against the benchmark over the last 3 years
Stock DNA
Non Banking Financial Company (NBFC)
INR 324 Cr (Micro Cap)
26.00
20
0.00%
4.56
1.88%
0.48
Total Returns (Price + Dividend) 
Latest dividend: 5.5 per share ex-dividend date: Mar-17-2016
Risk Adjusted Returns v/s
Returns Beta

News

Muthoot Capital Services Ltd Upgraded from Strong Sell to Sell on Technical and Valuation Improvements
Muthoot Capital Services Ltd, a micro-cap player in the Non Banking Financial Company (NBFC) sector, has seen its investment rating upgraded from Strong Sell to Sell as of 9 June 2026. This change reflects a nuanced improvement across technical indicators and valuation metrics, despite persistent challenges in financial trends and quality parameters. The stock’s recent performance and market context provide a comprehensive backdrop to this reassessment.
Read full news article
Muthoot Capital Services Ltd: Valuation Shifts Signal Improved Price Attractiveness Amid Lingering Challenges
Muthoot Capital Services Ltd, a micro-cap player in the Non Banking Financial Company (NBFC) sector, has seen a notable shift in its valuation parameters, moving from an expensive to a fair valuation grade. Despite this improvement, the company’s stock performance continues to lag behind broader market benchmarks, raising questions about its attractiveness for investors seeking value in the NBFC space.
Read full news article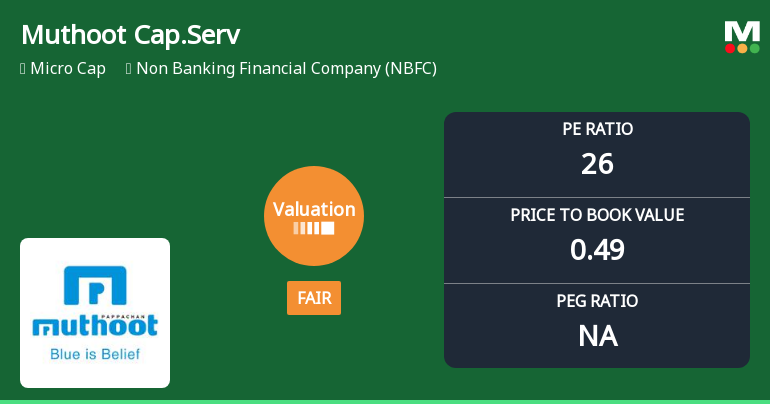
Muthoot Capital Services Ltd Valuation Shifts Signal Changing Market Sentiment
Muthoot Capital Services Ltd, a micro-cap player in the Non Banking Financial Company (NBFC) sector, has witnessed a notable shift in its valuation parameters, moving from an expensive to a fair valuation grade. This change reflects evolving market perceptions amid subdued financial performance and challenging sector dynamics, prompting a reassessment of its price attractiveness relative to peers and historical benchmarks.
Read full news article Announcements
Announcement under Regulation 30 (LODR)-Credit Rating
09-Jun-2026 | Source : BSEIntimation on upgradation of Long-term rating to Crisil AA-/Crisil PPMLD AA-/Stable and reaffirmation of Short-term rating
Announcement under Regulation 30 (LODR)-Raising of Funds
08-Jun-2026 | Source : BSERaising of funds through Securitization
Submission Of ESOP Trust Deed
22-May-2026 | Source : BSESubmission of ESOP Trust Deed
Corporate Actions

No Upcoming Board Meetings

Muthoot Capital Services Ltd has declared 55% dividend, ex-date: 17 Mar 16

No Splits history available

Muthoot Capital Services Ltd has announced 1:10 bonus issue, ex-date: 12 Jun 17

Muthoot Capital Services Ltd has announced 1:1 rights issue, ex-date: 24 May 11
Quality key factors
Valuation key factors
Technicals key factors
 Technical Indicator Scale: Bearish, Mildly Bearish, Sideways, Mildly Bullish, Bullish Turned
 Shareholding Snapshot : Mar 2026
Shareholding Compare (%holding)
Promoters
80.5323
Held by 0 Schemes
Held by 3 FIIs (1.3%)
Thomas John Muthoot (19.17%)
Thermo Capital Private Limited (2.95%)
24.34%
Quarterly Results Snapshot (Standalone) - Mar'26 - YoY

YoY Growth in quarter ended Mar 2026 is 21.29% vs 40.23% in Mar 2025

YoY Growth in quarter ended Mar 2026 is -16.36% vs -45.03% in Mar 2025
Half Yearly Results Snapshot (Standalone) - Sep'25
Growth in half year ended Sep 2025 is 43.40% vs 2.16% in Sep 2024
Growth in half year ended Sep 2025 is -106.87% vs -73.48% in Sep 2024
Nine Monthly Results Snapshot (Standalone) - Dec'25
YoY Growth in nine months ended Dec 2025 is 35.91% vs 11.44% in Dec 2024
YoY Growth in nine months ended Dec 2025 is -85.23% vs -64.56% in Dec 2024
Annual Results Snapshot (Standalone) - Mar'26
YoY Growth in year ended Mar 2026 is 31.67% vs 18.66% in Mar 2025
YoY Growth in year ended Mar 2026 is -75.58% vs -62.70% in Mar 2025
About Muthoot Capital Services Ltd

Company Coordinates


