
Compare Natl. Aluminium with Similar Stocks
Dashboard
Low Debt Company with Strong Long Term Fundamental Strength
- Healthy long term growth as Operating profit has grown by an annual rate 75.57%
- Company has a low Debt to Equity ratio (avg) at 0 times
- The company has been able to generate a Return on Capital Employed (avg) of 33.90% signifying high profitability per unit of total capital (equity and debt)
The company has declared Positive results for the last 9 consecutive quarters
High Institutional Holdings at 32.02%
Company is among the highest 1% of companies rated by MarketsMojo across all 4,000 stocks
Consistent Returns over the last 3 years
Stock DNA
Non - Ferrous Metals
INR 71,537 Cr (Mid Cap)
11.00
11
2.97%
-0.40
30.82%
3.43
Total Returns (Price + Dividend) 
Latest dividend: 4.5 per share ex-dividend date: Feb-06-2026
Risk Adjusted Returns v/s
Returns Beta

News
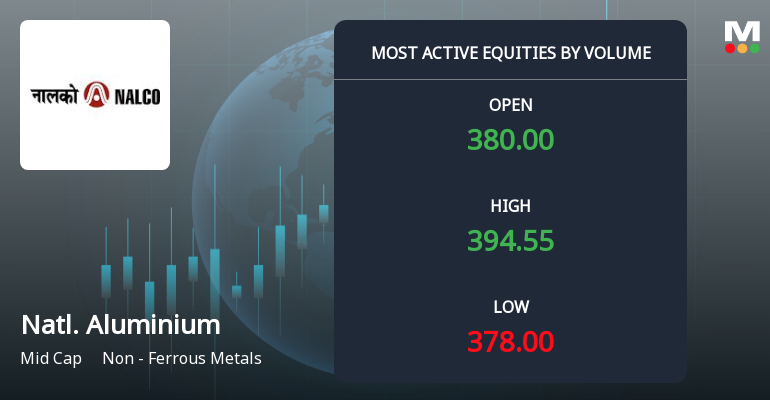
National Aluminium Company Ltd Sees Exceptional Volume Surge Amid Strong Buy Rating Upgrade
National Aluminium Company Ltd (NATIONALUM) has emerged as one of the most actively traded stocks today, registering a remarkable surge in volume and price following a recent upgrade to a Strong Buy rating. The mid-cap non-ferrous metals company witnessed a 6.11% gain intraday, supported by robust investor participation and heightened volatility, signalling strong accumulation in the stock.
Read full news article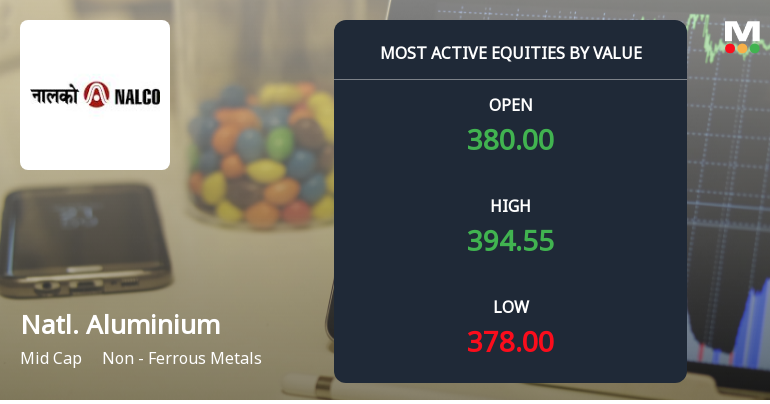
National Aluminium Company Ltd Sees Robust Trading Activity Amid Strong Institutional Interest
National Aluminium Company Ltd (NATIONALUM) has emerged as one of the most actively traded stocks by value on 30 March 2026, reflecting heightened investor interest and robust market momentum. The mid-cap non-ferrous metals company recorded a significant 6.11% gain on the day, supported by strong institutional participation and elevated trading volumes, signalling confidence in its near-term prospects despite sector volatility.
Read full news article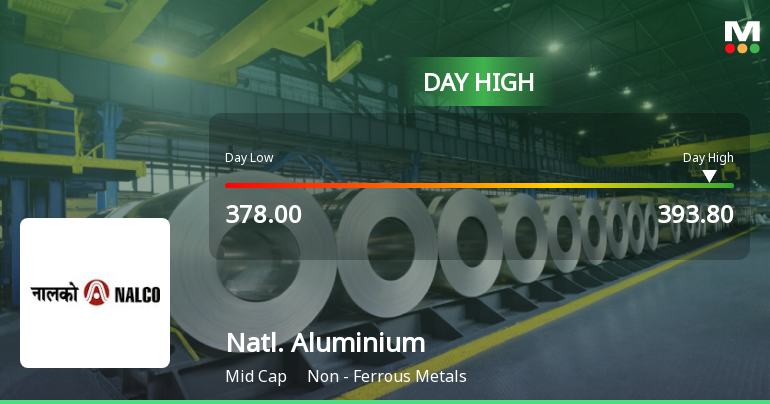
National Aluminium Company Ltd Surges 5.54% to Day's High of Rs 390.05 — Outperforms Sector by 2.99 Percentage Points
While the Sensex declined by 1.27% on 30 Mar 2026, National Aluminium Company Ltd surged 5.54%, marking a notable 2.99-percentage-point outperformance over its Non - Ferrous Metals sector. This strong intraday performance stands out sharply against the broader market weakness, signalling a stock-specific momentum shift rather than a general market uplift.
Read full news article Announcements
Closure of Trading Window
23-Mar-2026 | Source : BSEIntimation regarding closure of trading window.
Comments Of Board On The Fine Levied By The Stock Exchanges.
17-Mar-2026 | Source : BSEComments of Board on the fine levied by the Stock Exchanges.
Announcement under Regulation 30 (LODR)-Change in Management
07-Mar-2026 | Source : BSEIntimation regarding change in senior management (Revised with minor corrections in Brief profile)
Corporate Actions

No Upcoming Board Meetings

National Aluminium Company Ltd has declared 90% dividend, ex-date: 06 Feb 26

National Aluminium Company Ltd has announced 5:10 stock split, ex-date: 15 Mar 11

National Aluminium Company Ltd has announced 1:1 bonus issue, ex-date: 15 Mar 11

No Rights history available
Quality key factors
Valuation key factors
Technicals key factors
 Technical Indicator Scale: Bearish, Mildly Bearish, Sideways, Mildly Bullish, Bullish Turned
 Shareholding Snapshot : Dec 2025
Shareholding Compare (%holding)
Promoters
None
Held by 32 Schemes (7.05%)
Held by 452 FIIs (19.67%)
President Of India (51.28%)
Life Insurance Corporation Of India- P&gs Fund (2.6%)
13.71%
Quarterly Results Snapshot (Consolidated) - Dec'25 - QoQ

QoQ Growth in quarter ended Dec 2025 is 10.22% vs 12.75% in Sep 2025
QoQ Growth in quarter ended Dec 2025 is 11.55% vs 36.25% in Sep 2025
Half Yearly Results Snapshot (Consolidated) - Sep'25

Growth in half year ended Sep 2025 is 18.11% vs 10.22% in Sep 2024
Growth in half year ended Sep 2025 is 51.70% vs 213.64% in Sep 2024
Nine Monthly Results Snapshot (Consolidated) - Dec'25
YoY Growth in nine months ended Dec 2025 is 11.38% vs 20.38% in Dec 2024
YoY Growth in nine months ended Dec 2025 is 27.30% vs 222.74% in Dec 2024
Annual Results Snapshot (Consolidated) - Mar'25
YoY Growth in year ended Mar 2025 is 27.67% vs -7.77% in Mar 2024
YoY Growth in year ended Mar 2025 is 164.93% vs 38.60% in Mar 2024
About National Aluminium Company Ltd

Company Coordinates


