
Compare Natraj Proteins with Similar Stocks
Dashboard
Weak Long Term Fundamental Strength with a -7.11% CAGR growth in Net Sales over the last 5 years
- The company has been able to generate a Return on Equity (avg) of 6.97% signifying low profitability per unit of shareholders funds
Positive results in Mar 26
With ROCE of 1, it has a Attractive valuation with a 0.7 Enterprise value to Capital Employed
Majority shareholders : Non Institution
Consistent Underperformance against the benchmark over the last 3 years
Total Returns (Price + Dividend) 
Natraj Proteins for the last several years.
Risk Adjusted Returns v/s
Returns Beta

News
Natraj Proteins Ltd Upgraded to Hold on Technical Improvements and Financial Gains
Natraj Proteins Ltd, a micro-cap player in the edible oil sector, has seen its investment rating upgraded from Sell to Hold as of 15 July 2026. This change reflects a combination of improved technical indicators, positive quarterly financial results, and attractive valuation metrics despite some lingering concerns over long-term fundamentals and relative underperformance against benchmarks.
Read full news article
Natraj Proteins Ltd Downgraded to Sell Amid Mixed Financial and Technical Signals
Natraj Proteins Ltd, a micro-cap player in the edible oil sector, has seen its investment rating downgraded from Hold to Sell as of 7 July 2026. This change reflects a complex interplay of deteriorating technical indicators, a modest improvement in valuation, subdued financial trends, and an overall weak quality assessment. The stock’s recent performance and fundamental metrics suggest caution for investors amid ongoing sector challenges.
Read full news article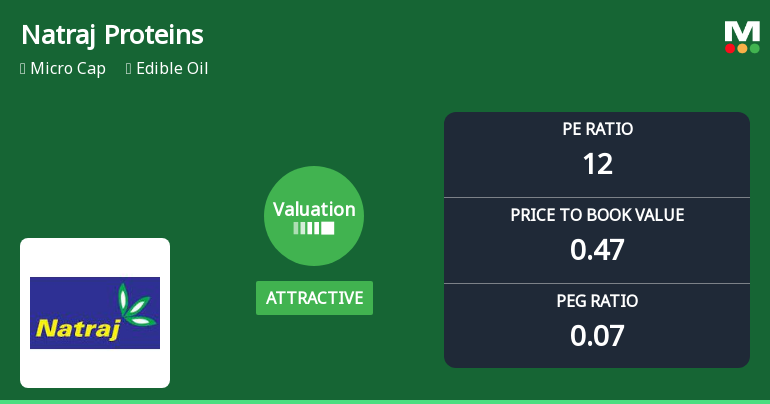
Natraj Proteins Ltd Valuation Shifts Signal Renewed Price Attractiveness
Natraj Proteins Ltd, a micro-cap player in the edible oil sector, has witnessed a notable shift in its valuation parameters, moving from a very attractive to an attractive rating. This change reflects evolving market perceptions and improved price metrics, positioning the stock as a more compelling option relative to its historical averages and peer group. Despite a recent 3.12% dip in daily trading, the company’s valuation multiples suggest a favourable entry point for investors seeking exposure in the edible oil industry.
Read full news article Announcements
Compliances-Certificate under Reg. 74 (5) of SEBI (DP) Regulations 2018
08-Jul-2026 | Source : BSECertificate for compliance of Regulation 74(5) of the SEBI (DP) Regulations 2018 for the Quarter ended 30th June 2026
Closure of Trading Window
26-Jun-2026 | Source : BSEThe window for trading in shares of the company shall remain close from 1st July2026 till the completion of 48 hours after declaration of Quarterly Un-audited financial results of the company.
Compliances-Reg.24(A)-Annual Secretarial Compliance
25-May-2026 | Source : BSEPursuant to Reg.24A of SEBI Listing Regulations and Master Circular issued by SEBI We are pleased to submit the Annual Secretarial Compliance report for the year ended on 31.03.2026
Corporate Actions

No Upcoming Board Meetings

No Dividend history available

No Splits history available

No Bonus history available

No Rights history available
Quality key factors
Valuation key factors
Technicals key factors
 Technical Indicator Scale: Bearish, Mildly Bearish, Sideways, Mildly Bullish, Bullish Turned
 Shareholding Snapshot : Mar 2026
Shareholding Compare (%holding)
Non Institution
None
Held by 1 Schemes (1.9%)
Held by 0 FIIs
Sharad Kumar Jain (6.38%)
Sangeetha S (5.75%)
50.93%
Quarterly Results Snapshot (Standalone) - Mar'26 - QoQ

QoQ Growth in quarter ended Mar 2026 is -34.41% vs 6.87% in Dec 2025
QoQ Growth in quarter ended Mar 2026 is -61.59% vs 275.15% in Dec 2025
Half Yearly Results Snapshot (Standalone) - Sep'25

Growth in half year ended Sep 2025 is -12.79% vs -68.35% in Sep 2024
Growth in half year ended Sep 2025 is -3.62% vs 77.96% in Sep 2024
Nine Monthly Results Snapshot (Standalone) - Dec'25
YoY Growth in nine months ended Dec 2025 is -13.17% vs -38.83% in Dec 2024
YoY Growth in nine months ended Dec 2025 is 101.10% vs 79.81% in Dec 2024
Annual Results Snapshot (Standalone) - Mar'26
YoY Growth in year ended Mar 2026 is -14.15% vs -39.20% in Mar 2025
YoY Growth in year ended Mar 2026 is 178.08% vs 88.34% in Mar 2025
About Natraj Proteins Ltd

Company Coordinates


