

Key Events This Week
29 Jun: Week opens at Rs.282.15
1 Jul: Stock rallies 2.42% to Rs.288.20 following rating downgrade
2 Jul: Technical momentum shifts to mildly bullish amid mixed indicator signals
3 Jul: Week closes at Rs.287.20, up 1.79% for the week
Wanbury Ltd Downgraded to Hold Amid Mixed Technical and Financial Signals
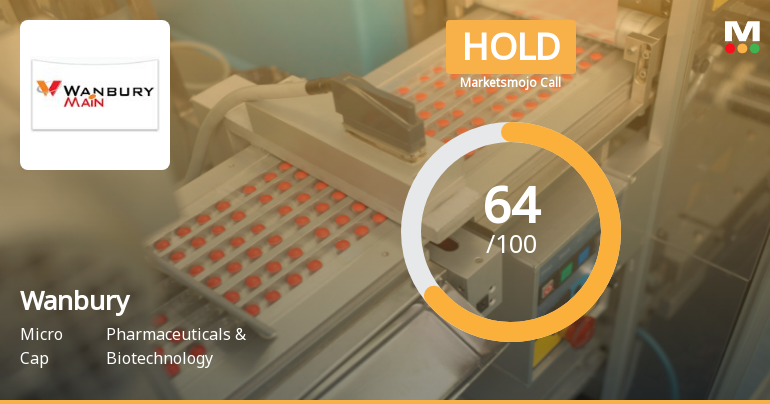
2026-07-02 08:44:45Wanbury Ltd, a micro-cap player in the Pharmaceuticals & Biotechnology sector, has seen its investment rating downgraded from Buy to Hold as of 1 July 2026. This adjustment reflects a nuanced reassessment across four key parameters: quality, valuation, financial trend, and technicals. Despite robust long-term growth and strong quarterly financials, concerns around technical indicators and elevated debt levels have tempered enthusiasm among analysts.
Read full news article
Wanbury Ltd Technical Momentum Shifts Amid Mixed Indicator Signals
2026-07-02 08:07:38Wanbury Ltd, a micro-cap player in the Pharmaceuticals & Biotechnology sector, has experienced a notable shift in its technical momentum, moving from a bullish to a mildly bullish trend. Despite a recent downgrade in its Mojo Grade from Buy to Hold, the stock’s price action and technical indicators reveal a complex picture of momentum and potential near-term volatility.
Read full news articleWanbury Ltd Gains 2.85%: Technical Upgrade and Strong Financials Drive Momentum
2026-06-27 14:02:28
Key Events This Week
22 Jun: Stock rallies 2.96% to Rs.274.50 on strong volume
23 Jun: Wanbury surges 3.61% to Rs.284.40 amid technical upgrade
24 Jun: Minor pullback of 1.44% to Rs.280.30 despite positive technical signals
25 Jun: Week closes at Rs.274.20, down 2.18% on moderate volume

Wanbury Ltd Upgraded to Buy on Strong Technical and Financial Performance
2026-06-25 08:25:21Wanbury Ltd, a micro-cap player in the Pharmaceuticals & Biotechnology sector, has seen its investment rating upgraded from Hold to Buy, reflecting significant improvements across technical indicators, financial trends, valuation metrics, and overall quality. This upgrade, effective from 24 June 2026, comes amid robust quarterly results, attractive valuation multiples, and a bullish technical outlook, signalling renewed investor confidence in the stock’s medium to long-term prospects.
Read full news article
Wanbury Ltd Technical Momentum Shifts Signal Bullish Outlook Amid Mixed Monthly Indicators
2026-06-25 08:03:54Wanbury Ltd, a micro-cap player in the Pharmaceuticals & Biotechnology sector, has witnessed a notable shift in its technical momentum, upgrading its MarketsMOJO grade from Hold to Buy as of 24 June 2026. Despite a modest day decline of 1.44%, the stock’s technical indicators reveal a predominantly bullish trend on weekly and daily charts, signalling potential upside amid mixed monthly signals.
Read full news article
Wanbury Ltd is Rated Hold by MarketsMOJO
2026-06-20 10:10:42Wanbury Ltd is rated 'Hold' by MarketsMOJO, with this rating last updated on 01 June 2026. However, the analysis and financial metrics presented here reflect the stock's current position as of 20 June 2026, providing investors with an up-to-date view of the company's fundamentals, returns, and market standing.
Read full news articleWanbury Limited - Updates
04-Nov-2019 | Source : NSEWanbury Limited has informed the Exchange regarding ''.
Wanbury Limited - Preferential issue
31-Oct-2019 | Source : NSEWanbury Limited has informed the Exchange about Preferential issue
Wanbury Limited - Outcome of Board Meeting
23-Oct-2019 | Source : NSEWanbury Limited has informed the Exchange regarding Board meeting held on October 22, 2019.
Corporate Actions

No Upcoming Board Meetings

Wanbury Ltd has declared 10% dividend, ex-date: 29 Jul 10

No Splits history available

No Bonus history available

No Rights history available


