
Compare Next Mediaworks with Similar Stocks
Dashboard
With a Negative Book Value, the company has a Weak Long Term Fundamental Strength
- Low ability to service debt as the company has a high Debt to EBITDA ratio of -38.92 times
- The company has reported losses and also has negative networth. This is not a good sign for the investors. Either company will have to raise fresh capital or report profits to sustain going forward
Flat results in Mar 26
Risky - Negative EBITDA
Below par performance in long term as well as near term
Stock DNA
Media & Entertainment
INR 27 Cr (Micro Cap)
NA (Loss Making)
12
0.00%
-1.37
60.78%
-1.07
Total Returns (Price + Dividend) 
Next Mediaworks for the last several years.
Risk Adjusted Returns v/s
Returns Beta

News

Next Mediaworks Ltd is Rated Strong Sell
Next Mediaworks Ltd is rated Strong Sell by MarketsMOJO, with this rating last updated on 24 Feb 2025. However, the analysis and financial metrics discussed below reflect the company’s current position as of 14 May 2026, providing investors with an up-to-date view of the stock’s fundamentals, returns, and technical outlook.
Read full news article
Next Mediaworks Ltd is Rated Strong Sell
Next Mediaworks Ltd is rated Strong Sell by MarketsMOJO, with this rating last updated on 24 February 2025. However, the analysis and financial metrics discussed here reflect the company’s current position as of 16 April 2026, providing investors with an up-to-date view of the stock’s fundamentals, valuation, financial trend, and technical outlook.
Read full news article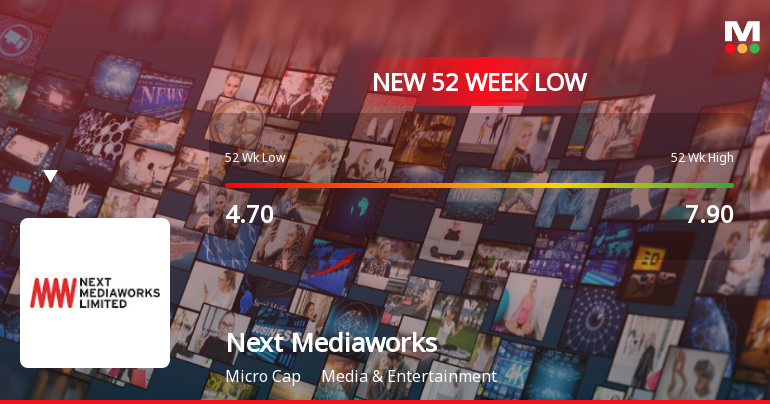
Announcements
Audited Financial Results For The Quarter And Financial Year Ended On 31 March 2026.
22-May-2026 | Source : BSEAudited Financial Results for the Quarter and Financial Year ended on 31 March 2026 is enclosed.
Board Meeting Outcome for Outcome Of The Board Meeting Held On May 22 2026.
22-May-2026 | Source : BSEOutcome of the Board Meeting held on May 22 2026 is enclosed.
Board Meeting Intimation for Approval Of Audited Financial Results Of The Company For The Quarter And Financial Year Ended On 31St March 2026
15-May-2026 | Source : BSENext Mediaworks Ltdhas informed BSE that the meeting of the Board of Directors of the Company is scheduled on 22/05/2026 inter alia to consider and approve Audited Financial Results of the Company for the quarter and financial year ended on 31st March 2026
Corporate Actions

No Upcoming Board Meetings

No Dividend history available

No Splits history available

No Bonus history available

No Rights history available
Quality key factors
Valuation key factors
Technicals key factors
 Technical Indicator Scale: Bearish, Mildly Bearish, Sideways, Mildly Bullish, Bullish Turned
 Shareholding Snapshot : Mar 2026
Shareholding Compare (%holding)
Promoters
None
Held by 0 Schemes
Held by 4 FIIs (2.45%)
Ht Media Limited (51.0%)
Bennett Coleman & Co Ltd (4.89%)
15.56%
Quarterly Results Snapshot (Standalone) - Mar'26 - QoQ
QoQ Growth in quarter ended Mar 2026 is 0.00% vs 0.00% in Dec 2025

QoQ Growth in quarter ended Mar 2026 is -87.38% vs 10.43% in Dec 2025
Half Yearly Results Snapshot (Standalone) - Sep'25
Growth in half year ended Sep 2025 is 0.00% vs 0.00% in Sep 2024
Growth in half year ended Sep 2025 is 11.45% vs 73.69% in Sep 2024
Nine Monthly Results Snapshot (Standalone) - Dec'25
YoY Growth in nine months ended Dec 2025 is 0.00% vs 0.00% in Dec 2024
YoY Growth in nine months ended Dec 2025 is 6.69% vs 67.66% in Dec 2024
Annual Results Snapshot (Standalone) - Mar'26
YoY Growth in year ended Mar 2026 is 0.00% vs 0.00% in Mar 2025
YoY Growth in year ended Mar 2026 is -234.01% vs 131.65% in Mar 2025
About Next Mediaworks Ltd

Company Coordinates


