
Compare NIIT Learning with Similar Stocks
Dashboard
High Management Efficiency with a high ROE of 18.74%
The company is Net-Debt Free
Poor long term growth as Net Sales has grown by an annual rate of 13.00% and Operating profit at 4.61% over the last 5 years
Flat results in Jun 26
With ROE of 14.5, it has a Very Attractive valuation with a 2.2 Price to Book Value
High Institutional Holdings at 39.83%
Below par performance in long term as well as near term
With its market cap of Rs 3,343 cr, it is the second biggest company in the sector (behind Crizac)and constitutes 32.61% of the entire sector
Stock DNA
Other Consumer Services
INR 3,309 Cr (Small Cap)
15.00
18
1.23%
-0.37
14.52%
2.17
Total Returns (Price + Dividend) 
Latest dividend: 3 per share ex-dividend date: Sep-04-2025
Risk Adjusted Returns v/s
Returns Beta

News

NIIT Learning Systems Ltd is Rated Hold
NIIT Learning Systems Ltd is rated 'Hold' by MarketsMOJO, with this rating last updated on 07 July 2026. While the rating change occurred on that date, the analysis and financial metrics discussed here reflect the stock's current position as of 30 July 2026, providing investors with the latest insights into the company’s performance and outlook.
Read full news article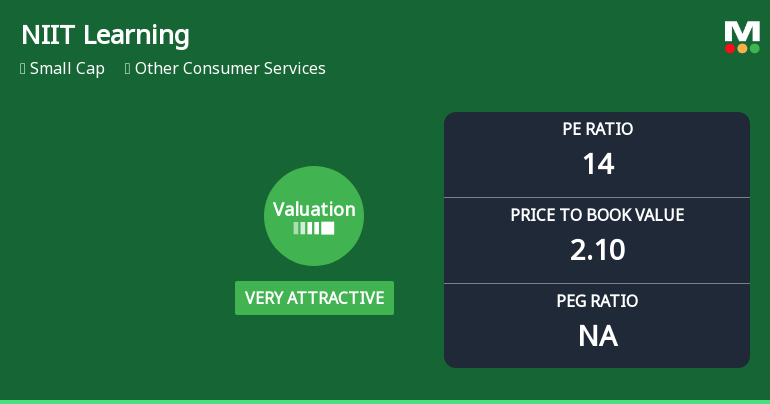
NIIT Learning Systems Ltd Valuation Shifts to Very Attractive Amid Market Challenges
NIIT Learning Systems Ltd has seen a significant improvement in its valuation parameters, moving from an attractive to a very attractive grade, despite ongoing market headwinds and a challenging price performance relative to benchmarks. This shift reflects a notable change in investor perception, driven by the company’s current price-to-earnings and price-to-book value ratios, which now stand favourably against historical averages and peer comparisons.
Read full news articleAre NIIT Learning Systems Ltd latest results good or bad?
NIIT Learning Systems Ltd has reported its financial results for the quarter ending June 2026, showcasing a complex operational landscape. The company achieved a record quarterly revenue of ₹565.08 crores, reflecting a year-on-year growth of 25.20% and a sequential increase of 7.59%. This robust top-line performance indicates strong demand and successful expansion within the education services sector. However, the profitability metrics present a more nuanced picture. The net profit for the quarter stood at ₹57.41 crores, which is a 16.45% year-on-year increase. In contrast, there was a significant sequential decline of 25.55% from the previous quarter's net profit of ₹77.11 crores. This sharp contraction raises concerns regarding the sustainability of earnings and operational efficiency. The operating margin, excluding other income, has compressed to 16.45%, down from 20.03% in the same quarter last year,...
Read full news article Announcements
Announcement under Regulation 30 (LODR)-Press Release / Media Release
29-Jul-2026 | Source : BSEPress release dated July 29 2026.
Intimation About Grant Of Stock Options Under NLSL Employee Stock Option Plan 2024
28-Jul-2026 | Source : BSEIntimation about Grant of Stock Options under NLSL Employee Stock Option Plan 2024
Announcement under Regulation 30 (LODR)-Newspaper Publication
24-Jul-2026 | Source : BSEPlease find copy of newspaper publication of extracts of unaudited financial results for June 30 2026.
Corporate Actions

No Upcoming Board Meetings

NIIT Learning Systems Ltd has declared 150% dividend, ex-date: 04 Sep 25

No Splits history available

No Bonus history available

No Rights history available
Quality key factors
Valuation key factors
Technicals key factors
 Technical Indicator Scale: Bearish, Mildly Bearish, Sideways, Mildly Bullish, Bullish Turned
 Shareholding Snapshot : Jun 2026
Shareholding Compare (%holding)
Promoters
None
Held by 5 Schemes (19.08%)
Held by 80 FIIs (14.44%)
Vijay Kumar Thadani As Trustee Of Thadani Family Trust (16.72%)
Nippon Life India Trustee Ltd. - A/c Nippon India Small Cap Fund (8.88%)
17.57%
Quarterly Results Snapshot (Consolidated) - Jun'26 - QoQ

QoQ Growth in quarter ended Jun 2026 is 7.59% vs 5.11% in Mar 2026

QoQ Growth in quarter ended Jun 2026 is -25.55% vs 3.73% in Mar 2026
Half Yearly Results Snapshot (Consolidated) - Sep'25
Growth in half year ended Sep 2025 is 15.21% vs 5.29% in Sep 2024
Growth in half year ended Sep 2025 is -17.76% vs 14.71% in Sep 2024
Nine Monthly Results Snapshot (Consolidated) - Dec'25
YoY Growth in nine months ended Dec 2025 is 16.61% vs 5.88% in Dec 2024
YoY Growth in nine months ended Dec 2025 is -4.58% vs 12.59% in Dec 2024
Annual Results Snapshot (Consolidated) - Mar'26
YoY Growth in year ended Mar 2026 is 18.07% vs 6.42% in Mar 2025
YoY Growth in year ended Mar 2026 is 8.89% vs 6.69% in Mar 2025
About NIIT Learning Systems Ltd

Company Coordinates


