
Compare NINtec Systems with Similar Stocks
Dashboard
The company is Net-Debt Free
Healthy long term growth as Net Sales has grown by an annual rate of 43.10% and Operating profit at 47.86%
The company has declared Positive results for the last 11 consecutive quarters
With ROE of 34.9, it has a Expensive valuation with a 14.1 Price to Book Value
Despite the size of the company, domestic mutual funds hold only 0% of the company
Market Beating performance in long term as well as near term
Stock DNA
Computers - Software & Consulting
INR 1,300 Cr (Micro Cap)
40.00
20
0.00%
-0.80
34.93%
14.04
Total Returns (Price + Dividend) 
NINtec Systems for the last several years.
Risk Adjusted Returns v/s
Returns Beta

News
NINtec Systems Ltd is Rated Hold by MarketsMOJO
NINtec Systems Ltd is rated 'Hold' by MarketsMOJO, with this rating last updated on 04 May 2026. While the rating change occurred on that date, the analysis and financial metrics discussed here reflect the stock’s current position as of 09 June 2026, providing investors with the most up-to-date view of the company’s fundamentals, returns, and market performance.
Read full news article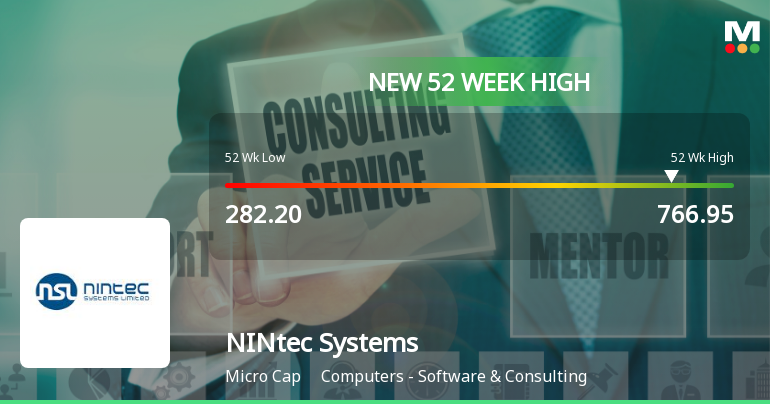
Broad-Based Technical Strength Lifts NINtec Systems Ltd to 52-Week High of Rs 766.95
With a remarkable 53.5% gain over the past year, NINtec Systems Ltd surged to a fresh 52-week and all-time high of Rs 766.95 on 2 Jun 2026, defying the broader market's subdued tone and showcasing robust technical momentum.
Read full news article
Broad-Based Technical Strength Lifts NINtec Systems Ltd to 52-Week High of Rs 766.95
Surging past its previous peaks, NINtec Systems Ltd touched a fresh 52-week high of Rs 766.95 on 2 Jun 2026, marking a remarkable 171.6% rise from its 52-week low of Rs 282.20. This milestone comes amid a backdrop of strong technical momentum, even as the broader market shows signs of caution.
Read full news article Announcements
Announcement under Regulation 30 (LODR)-Newspaper Publication
28-May-2026 | Source : BSENewspaper Publication
General - Intimation Of Change In The Logo Of The Company
28-May-2026 | Source : BSEIntimation of change in the logo of the Company
Announcement under Regulation 30 (LODR)-Press Release / Media Release
28-May-2026 | Source : BSEPress Release
Corporate Actions

No Upcoming Board Meetings

No Dividend history available

No Splits history available

NINtec Systems Ltd has announced 4:5 bonus issue, ex-date: 03 Aug 23

No Rights history available
Quality key factors
Valuation key factors
Technicals key factors
 Technical Indicator Scale: Bearish, Mildly Bearish, Sideways, Mildly Bullish, Bullish Turned
 Shareholding Snapshot : Mar 2026
Shareholding Compare (%holding)
Non Institution
None
Held by 0 Schemes
Held by 0 FIIs
Niraj Chhaganraj Gemawat (18.3%)
Tecthink B.v (25.44%)
23.68%
Quarterly Results Snapshot (Consolidated) - Mar'26 - YoY

YoY Growth in quarter ended Mar 2026 is 22.51% vs 18.54% in Mar 2025

YoY Growth in quarter ended Mar 2026 is 18.91% vs 29.63% in Mar 2025
Half Yearly Results Snapshot (Standalone) - Sep'25
Growth in half year ended Sep 2025 is 17.35% vs 48.05% in Sep 2024
Growth in half year ended Sep 2025 is 22.81% vs 81.10% in Sep 2024
Nine Monthly Results Snapshot (Standalone) - Dec'25
YoY Growth in nine months ended Dec 2025 is 19.27% vs 37.88% in Dec 2024
YoY Growth in nine months ended Dec 2025 is 18.84% vs 79.57% in Dec 2024
Annual Results Snapshot (Consolidated) - Mar'26
YoY Growth in year ended Mar 2026 is 21.72% vs 68.33% in Mar 2025
YoY Growth in year ended Mar 2026 is 21.62% vs 69.70% in Mar 2025
About NINtec Systems Ltd

Company Coordinates


