
Compare NMDC with Similar Stocks
Dashboard
Strong Long Term Fundamental Strength with an average Return on Equity (ROE) of 27.95%
- Healthy long term growth as Net Sales has grown by an annual rate of 15.85%
- The company is Net-Debt Free
Positive results in Mar 26
With ROE of 21.9, it has a Attractive valuation with a 2.2 Price to Book Value
High Institutional Holdings at 27.4%
Market Beating Performance
Stock DNA
Minerals & Mining
INR 75,680 Cr (Mid Cap)
10.00
10
4.08%
-0.15
21.87%
2.22
Total Returns (Price + Dividend) 
Latest dividend: 2.5 per share ex-dividend date: Feb-13-2026
Risk Adjusted Returns v/s
Returns Beta

News
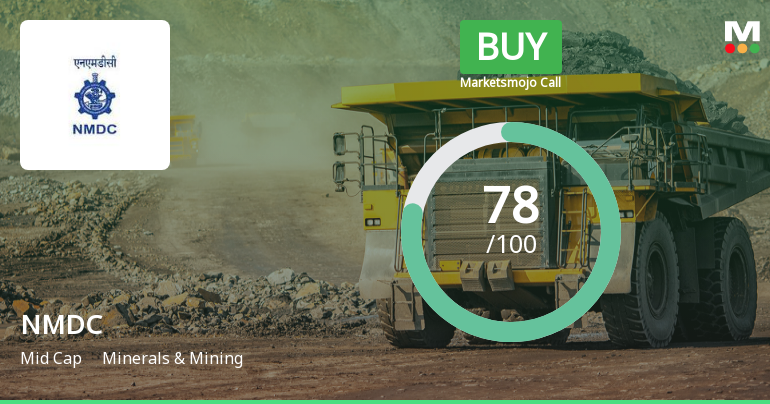
NMDC Ltd is Rated Buy by MarketsMOJO
NMDC Ltd is currently rated as a 'Buy' by MarketsMOJO, with this rating last updated on 15 June 2026. While the rating change occurred mid-June, the analysis and financial metrics discussed here reflect the stock's current position as of 30 July 2026, providing investors with the most up-to-date view of the company’s fundamentals, returns, and market performance.
Read full news article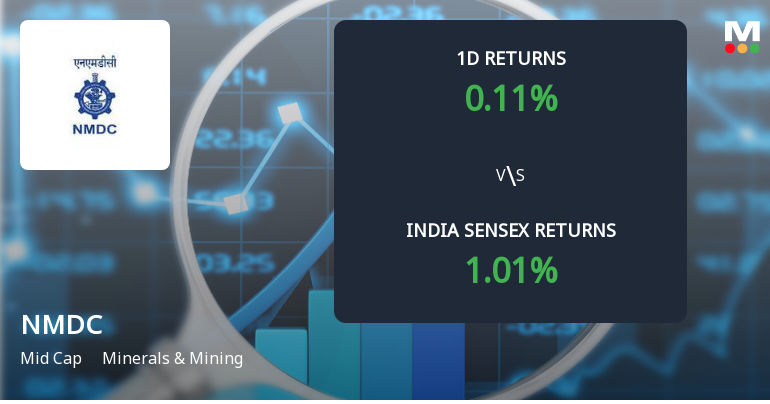
NMDC Ltd Sees Significant Open Interest Surge Amid Mixed Market Signals
NMDC Ltd, a prominent player in the Minerals & Mining sector, has witnessed a notable 10.38% surge in open interest in its derivatives segment, signalling increased market activity and shifting investor positioning. Despite a modest 0.05% price gain today, the underlying dynamics suggest a complex interplay of bullish and cautious bets among traders.
Read full news article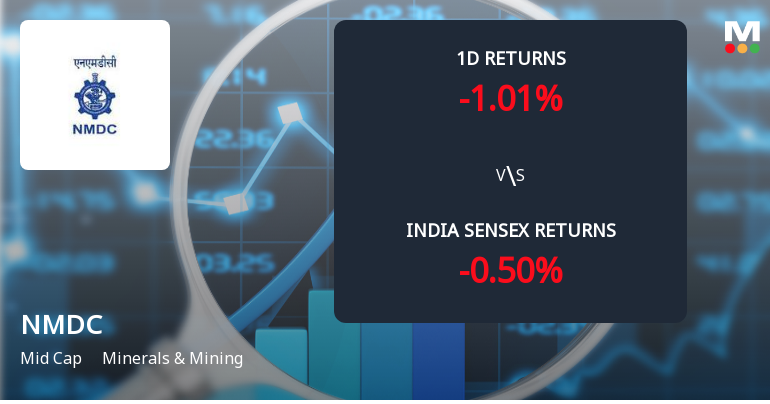
NMDC Ltd Sees Sharp Open Interest Surge Amid Mixed Price Action and Volume Trends
NMDC Ltd, a mid-cap player in the Minerals & Mining sector, has witnessed a notable 14.4% surge in open interest in its derivatives segment, signalling heightened market activity despite a modest price decline. This development reflects evolving market positioning and potential directional bets as investors reassess the stock’s outlook amid recent volatility.
Read full news article Announcements
Announcement under Regulation 30 (LODR)-Change in Directorate
18-Jul-2026 | Source : BSEChange in Directorate - Intimation of appointment of Shri Vivek Nishant Nath as Director (Commercial) on the Board of the Company.
Intimation Of The Receipt Of Order Issued By Ministry Of Steel Government Of India In Respect Of Appointment Of Shri Vivek Nishant Nath As Director (Commercial) On The Board Of The Company
15-Jul-2026 | Source : BSEAs per attachments.
Prices Of Iron Ore W.E.F. 10Th July 2026
10-Jul-2026 | Source : BSEAs per the attachment
Corporate Actions

No Upcoming Board Meetings

NMDC Ltd has declared 250% dividend, ex-date: 13 Feb 26

NMDC Ltd has announced 1:10 stock split, ex-date: 10 Apr 08

NMDC Ltd has announced 2:1 bonus issue, ex-date: 27 Dec 24

No Rights history available
Quality key factors
Valuation key factors
Technicals key factors
 Technical Indicator Scale: Bearish, Mildly Bearish, Sideways, Mildly Bullish, Bullish Turned
 Shareholding Snapshot : Jun 2026
Shareholding Compare (%holding)
Promoters
None
Held by 44 Schemes (6.91%)
Held by 622 FIIs (13.59%)
President Of India (60.79%)
Life Insurance Corporation Of India - P & Gs Fund (4.54%)
9.99%
Quarterly Results Snapshot (Consolidated) - Mar'26 - QoQ

QoQ Growth in quarter ended Mar 2026 is 49.04% vs 19.33% in Dec 2025
QoQ Growth in quarter ended Mar 2026 is 15.41% vs 3.40% in Dec 2025
Half Yearly Results Snapshot (Consolidated) - Sep'25
Growth in half year ended Sep 2025 is 26.94% vs 9.83% in Sep 2024

Growth in half year ended Sep 2025 is 15.22% vs 18.81% in Sep 2024
Nine Monthly Results Snapshot (Consolidated) - Dec'25
YoY Growth in nine months ended Dec 2025 is 22.64% vs 14.05% in Dec 2024
YoY Growth in nine months ended Dec 2025 is 7.09% vs 21.67% in Dec 2024
Annual Results Snapshot (Consolidated) - Mar'26
YoY Growth in year ended Mar 2026 is 34.16% vs 12.19% in Mar 2025
YoY Growth in year ended Mar 2026 is 13.89% vs 17.34% in Mar 2025
About NMDC Ltd

Company Coordinates


