
Compare NOCIL with Similar Stocks
Dashboard
Poor long term growth as Operating profit has grown by an annual rate -13.10% of over the last 5 years
The company has declared Negative results for the last 6 consecutive quarters
With ROE of 3.3, it has a Very Expensive valuation with a 1.5 Price to Book Value
Consistent Underperformance against the benchmark over the last 3 years
Stock DNA
Specialty Chemicals
INR 2,761 Cr (Small Cap)
46.00
42
1.23%
-0.19
3.35%
1.53
Total Returns (Price + Dividend) 
Latest dividend: 2 per share ex-dividend date: Jul-30-2025
Risk Adjusted Returns v/s
Returns Beta

News

NOCIL Ltd is Rated Sell by MarketsMOJO
NOCIL Ltd is rated Sell by MarketsMOJO, with this rating last updated on 25 May 2026. While the rating change occurred on that date, the analysis and financial metrics discussed here reflect the stock’s current position as of 08 June 2026, providing investors with the most up-to-date view of the company’s performance and outlook.
Read full news article
NOCIL Ltd is Rated Sell by MarketsMOJO
NOCIL Ltd is rated 'Sell' by MarketsMOJO, with this rating last updated on 25 May 2026. However, the analysis and financial metrics discussed here reflect the stock's current position as of 08 June 2026, providing investors with an up-to-date view of the company’s performance and outlook.
Read full news article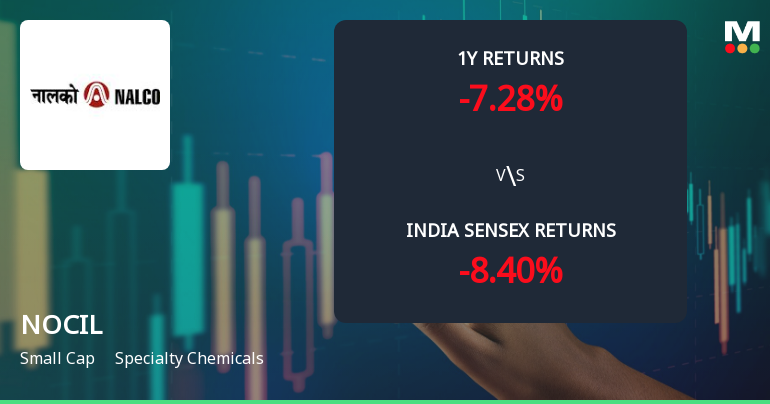
NOCIL Ltd Technical Momentum Shifts Amid Mixed Market Signals
NOCIL Ltd, a small-cap player in the Specialty Chemicals sector, has experienced a nuanced shift in its technical momentum, reflecting a complex interplay of bullish and bearish signals across multiple timeframes. Despite a recent downgrade in its Mojo Grade from Strong Sell to Sell, the stock’s price action and technical indicators suggest a cautiously optimistic outlook amid broader market challenges.
Read full news article Announcements
Communication To Shareholders- Intimation Regarding Tax Deduction On Dividend
09-Jun-2026 | Source : BSECommunication to Shareholders- Intimation Regarding Tax Deduction on Dividend
Announcement under Regulation 30 (LODR)-Newspaper Publication
05-Jun-2026 | Source : BSENewspaper Advertisement regarding Annual General Meeting to be held on 3rd August 2026 at 3:00pm
Announcement under Regulation 30 (LODR)-Change in Directorate
26-May-2026 | Source : BSEMr. Vilas R Gupte has ceased to be an Independent Director of the Company upon the completion of his tenure of 5 years on 26th May 2026
Corporate Actions

No Upcoming Board Meetings

NOCIL Ltd has declared 15% dividend, ex-date: 24 Jul 26

No Splits history available

No Bonus history available

No Rights history available
Quality key factors
Valuation key factors
Technicals key factors
 Technical Indicator Scale: Bearish, Mildly Bearish, Sideways, Mildly Bullish, Bullish Turned
 Shareholding Snapshot : Mar 2026
Shareholding Compare (%holding)
Non Institution
22.6445
Held by 8 Schemes (7.13%)
Held by 59 FIIs (4.55%)
Hrishikesh Arvind Mafatlal(as A Trustee Of Gurukripa Trust) (18.16%)
Icici Prudential Commodities Fund (3.35%)
44.36%
Quarterly Results Snapshot (Consolidated) - Mar'26 - QoQ

QoQ Growth in quarter ended Mar 2026 is 4.59% vs -1.47% in Dec 2025
QoQ Growth in quarter ended Mar 2026 is 83.78% vs -23.68% in Dec 2025
Half Yearly Results Snapshot (Consolidated) - Sep'25

Growth in half year ended Sep 2025 is -10.63% vs -1.70% in Sep 2024
Growth in half year ended Sep 2025 is -57.54% vs 12.58% in Sep 2024
Nine Monthly Results Snapshot (Consolidated) - Dec'25
YoY Growth in nine months ended Dec 2025 is -7.63% vs -3.23% in Dec 2024
YoY Growth in nine months ended Dec 2025 is -52.94% vs -10.24% in Dec 2024
Annual Results Snapshot (Consolidated) - Mar'26
YoY Growth in year ended Mar 2026 is -6.44% vs -3.60% in Mar 2025
YoY Growth in year ended Mar 2026 is -45.92% vs -22.66% in Mar 2025
About NOCIL Ltd

Company Coordinates


