
Compare Onward Technolog with Similar Stocks
Dashboard
Company has a Debt to Equity ratio (avg) of 0.01 times
Healthy long term growth as Operating profit has grown by an annual rate 52.44%
The company has declared Positive results for the last 5 consecutive quarters
With ROE of 18.4, it has a Very Attractive valuation with a 2.2 Price to Book Value
Increasing Participation by Institutional Investors
Consistent Underperformance against the benchmark over the last 3 years
Stock DNA
Computers - Software & Consulting
INR 580 Cr (Micro Cap)
12.00
20
1.99%
-0.28
18.44%
2.25
Total Returns (Price + Dividend) 
Latest dividend: 5 per share ex-dividend date: Jul-04-2025
Risk Adjusted Returns v/s
Returns Beta

News

Onward Technologies Ltd is Rated Hold
Onward Technologies Ltd is rated 'Hold' by MarketsMOJO, with this rating last updated on 23 February 2026. However, the analysis and financial metrics discussed below reflect the stock's current position as of 09 June 2026, providing investors with an up-to-date view of the company’s fundamentals, valuation, financial trends, and technical outlook.
Read full news article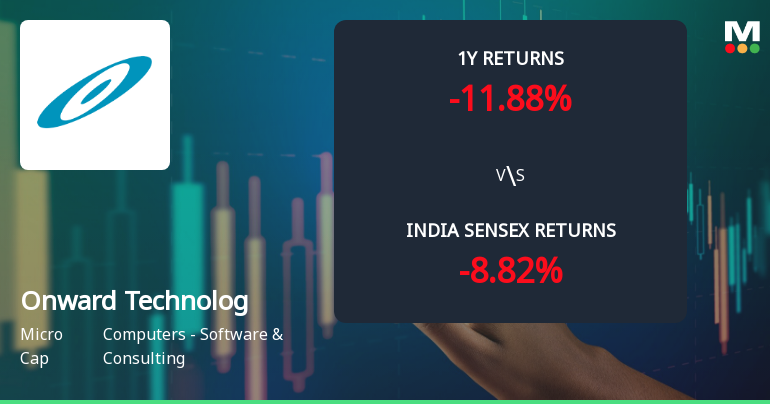
Onward Technologies Ltd Sees Technical Momentum Shift Amid Mixed Market Signals
Onward Technologies Ltd, a micro-cap player in the Computers - Software & Consulting sector, has experienced a shift in its technical momentum from sideways to mildly bearish. Despite a recent downgrade in its Mojo Grade from Buy to Hold, the stock exhibits a complex blend of bullish and bearish signals across key technical indicators, reflecting a nuanced market sentiment as it navigates price pressures and sector dynamics.
Read full news article
Onward Technologies Ltd: Technical Momentum Shifts Signal Mixed Outlook Amid Market Volatility
Onward Technologies Ltd, a micro-cap player in the Computers - Software & Consulting sector, has experienced a notable shift in its technical momentum, moving from a mildly bearish stance to a sideways trend. Despite a recent downgrade in its Mojo Grade from Buy to Hold, the stock exhibits a complex interplay of technical indicators that suggest cautious optimism amid ongoing market volatility.
Read full news article Announcements
Announcement under Regulation 30 (LODR)-Post Buyback Public Announcement
09-Jun-2026 | Source : BSEPost Buyback Public Announcement
Compliances-Reg.24(A)-Annual Secretarial Compliance
28-May-2026 | Source : BSEAnnual Secretarial Compliance report for the period year ended March 31 2026
Announcement under Regulation 30 (LODR)-Newspaper Publication
23-May-2026 | Source : BSENewspaper Advertisement
Corporate Actions

No Upcoming Board Meetings

Onward Technologies Ltd has declared 50% dividend, ex-date: 04 Jul 25

No Splits history available

No Bonus history available

No Rights history available
Quality key factors
Valuation key factors
Technicals key factors
 Technical Indicator Scale: Bearish, Mildly Bearish, Sideways, Mildly Bullish, Bullish Turned
 Shareholding Snapshot : Mar 2026
Shareholding Compare (%holding)
Non Institution
None
Held by 3 Schemes (2.47%)
Held by 8 FIIs (9.83%)
Jhm Enterprises Private Limited (34.52%)
Infinity Direct Holdings (8.71%)
31.24%
Quarterly Results Snapshot (Consolidated) - Mar'26 - YoY

YoY Growth in quarter ended Mar 2026 is 7.72% vs 7.47% in Mar 2025

YoY Growth in quarter ended Mar 2026 is -8.26% vs 55.84% in Mar 2025
Half Yearly Results Snapshot (Consolidated) - Sep'25
Growth in half year ended Sep 2025 is 13.08% vs 0.33% in Sep 2024
Growth in half year ended Sep 2025 is 132.08% vs -48.02% in Sep 2024
Nine Monthly Results Snapshot (Consolidated) - Dec'25
YoY Growth in nine months ended Dec 2025 is 11.73% vs 2.85% in Dec 2024
YoY Growth in nine months ended Dec 2025 is 108.58% vs -38.80% in Dec 2024
Annual Results Snapshot (Consolidated) - Mar'26
YoY Growth in year ended Mar 2026 is 10.69% vs 4.01% in Mar 2025
YoY Growth in year ended Mar 2026 is 63.66% vs -20.17% in Mar 2025
About Onward Technologies Ltd

Company Coordinates


