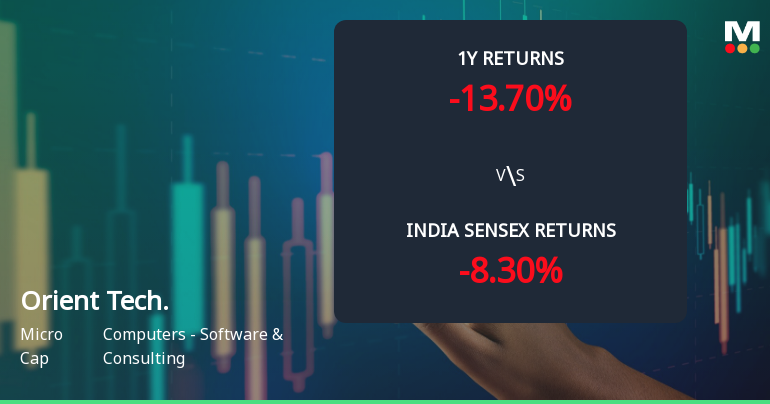
Orient Tech.

  • Market Cap: Micro Cap
  • Industry: Computers - Software & Consulting
  • ISIN: INE0PPK01015
  • NSEID: ORIENTTECH
  • BSEID: 544235
INR
236.35
0.1 (0.04%)
BSENSE

Sep 18, 03:30 PM

BSE+NSE Vol: 1.74 lacs

  • Price Points
  • Score
  • Mojo Parameters
  • Total Return
  • News and Corporate Actions
  • Key factors
  • Shareholding
  • Financials
  • CompanyCV
stock-summaryPrice Point
High/Low

1Day

52 Week

Valuation
Technical
Day's Volume

CASH

1.74 lacs (-91.18%) Volume

Shareholding (Jun 2026)

FII

0.05%

Held by 4 FIIs

DII

0.00%

Held by 0 DIIs

Promoter

70.66%

Why is Orient Technologies Ltd falling/rising?

06-Sep-2026

As of 05-Sep, Orient Technologies Ltd's stock price is slightly up at 238.95, but it has experienced significant declines of 42.11% year-to-date and 8.40% over the past month. The stock is trading below its moving averages, indicating a bearish trend and reduced investor interest.

As of 05-Sep, Orient Technologies Ltd is experiencing a slight increase in its stock price, currently at 238.95, with a change of 0.1 (0.04%) upwards. However, despite this minor uptick, the stock has shown a significant decline over various periods. Over the past week, it has fallen by 2.41%, and in the past month, the decline is even steeper at 8.40%. Year-to-date, the stock has decreased by 42.11%, which is considerably worse than the Sensex's decline of 10.21% in the same timeframe. <BR><BR>Today's performance is described as inline with the sector, but it is important to note that Orient Technologies is trading below its moving averages across multiple time frames, including the 5-day, 20-day, 50-day, 100-day, and 200-day averages. This indicates a bearish trend. Additionally, there has been a notable decrease in investor participation, with delivery volume dropping by 45% compared to the 5-day average, suggesting reduced interest from investors. <BR><BR>Overall, while there is a slight rise in the stock price today, the broader context shows a consistent decline in performance and investor engagement, which are critical factors contributing to the stock's overall downward trend.

View full answer

What does Orient Tech. do?

01-Sep-2026

Orient Technologies Ltd is a Micro Cap company in the Computers - Software & Consulting industry, recently converted to a Public Limited Company. As of June 2026, it reported net sales of 202 Cr and a net profit of 5 Cr, with a market cap of INR 1,104 Cr.

Overview:<BR>Orient Technologies Ltd operates in the Computers - Software & Consulting industry and is categorized as a Micro Cap company.<BR><BR>History:<BR>The company was originally incorporated as Orient Technologies Private Limited in 1997 and was converted into a Public Limited Company with its name changed to Orient Technologies Limited on October 12, 2023. The latest quarterly results reported net sales and profit for June 2026.<BR><BR>Financial Snapshot:<BR>Most recent Net Sales: 202 Cr (Quarterly Results - Jun 2026) <BR>Most recent Net Profit: 5 Cr (Quarterly Results - Jun 2026) <BR>Market-cap value: INR 1,104 Cr (Micro Cap)<BR><BR>Key Metrics:<BR>P/E: 52.00 <BR>Industry P/E: 22 <BR>Dividend Yield: 0.00% <BR>Debt-Equity: -0.03 <BR>Return on Equity: 6.26% <BR>Price-to-Book: 3.35 <BR><BR>Contact Details:<BR>Registrar Address: Not available. <BR>Phone: N/A <BR>Email: N/A <BR>Website: N/A

View full answer

Who are the peers of the Orient Tech.?

01-Sep-2026

Peers of Orient Tech. include InfoBeans Tech., Dynacons Sys., Expleo Solutions, NINtec Systems, IZMO, Kellton Tech, Sahana Systems, and TAC Infosec. Orient Tech. has Below Average management risk and growth, with a 1-year return of -13.21%.

Peers: The peers of Orient Tech. are InfoBeans Tech., Dynacons Sys., Expleo Solutions, NINtec Systems, IZMO, Kellton Tech, Sahana Systems, and TAC Infosec.<BR><BR>Quality Snapshot: Excellent management risk is observed at NINtec Systems, Sahana Systems, and TAC Infosec, while Average management risk is found at InfoBeans Tech., Dynacons Sys., Expleo Solutions, IZMO, Orient Tech., and Kellton Tech. Below Average management risk is noted at IZMO. Growth is Excellent at Dynacons Sys., NINtec Systems, Sahana Systems, and TAC Infosec, while Good growth is seen at InfoBeans Tech., Expleo Solutions, and IZMO. Orient Tech. and Kellton Tech. exhibit Below Average growth, and the rest have Average growth. Excellent capital structure is present at InfoBeans Tech., Expleo Solutions, NINtec Systems, IZMO, and Sahana Systems, while Good capital structure is noted at Kellton Tech. and Average capital structure is found at Orient Tech. and Dynacons Sys.<BR><BR>Return Snapshot: NINtec Systems has the highest 1-year return at 61.08%, while Kellton Tech has the lowest at -45.02%. Orient Tech.'s 1-year return of -13.21% is better than Kellton Tech's but worse than NINtec Systems. Additionally, Dynacons Sys., Expleo Solutions, Kellton Tech, and Orient Tech. have negative six-month returns.

View full answer

How big is Orient Tech.?

01-Sep-2026

As of 31st August, Orient Technologies Ltd has a market capitalization of 1,104.00 Cr, with Net Sales of 586.09 Cr and a Net Profit loss of 14.46 Cr for the latest four quarters. Shareholder's Funds are 329.68 Cr and Total Assets are valued at 521.26 Cr as of March 2025.

As of 31st August, Orient Technologies Ltd has a market capitalization of 1,104.00 Cr, categorized as a Micro Cap.<BR><BR>For the latest four quarters, the company reported Net Sales of 586.09 Cr. However, it experienced a loss of 14.46 Cr in Net Profit over the same period.<BR><BR>The latest annual reporting period for the balance sheet is March 2025, with Shareholder's Funds amounting to 329.68 Cr and Total Assets valued at 521.26 Cr.

View full answer

Should I buy, sell or hold Orient Technologies Ltd?

14-Aug-2026

Are Orient Technologies Ltd latest results good or bad?

12-Aug-2026

Orient Technologies Ltd's latest results show a mixed performance: while the net loss has narrowed significantly, sales declined by 8.01%, raising concerns about growth sustainability. Overall, the financial outlook remains cautious due to ongoing profitability challenges.

Orient Technologies Ltd's latest results present a mixed picture. On one hand, the company reported a consolidated net loss of ₹4.99 crores for Q4 FY26, which is a significant improvement of 65.92% compared to the previous quarter's loss of ₹14.64 crores. This narrowing of losses is a positive sign, indicating some progress in managing operational challenges.<BR><BR>However, the net sales for the quarter declined by 8.01% quarter-on-quarter to ₹184.07 crores, marking the lowest revenue in recent periods. This contraction raises concerns about the company's ability to sustain growth, especially in the software and consulting sector where demand is typically more resilient.<BR><BR>On the operational side, the company did achieve an improvement in its operating margin, which increased to 2.43% from 1.42% in the previous quarter, reflecting better cost management. Despite this, the overall financial trend remains negative, with consecutive quarterly losses and a decline in key performance metrics.<BR><BR>In summary, while there are some positive developments, such as reduced losses and improved margins, the decline in sales and ongoing profitability challenges suggest that the latest results are not entirely favorable. Investors should exercise caution and monitor the company's ability to stabilize its revenue and return to profitability in the coming quarters.

View full answer

When is the next results date for Orient Technologies Ltd?

06-Aug-2026

The next results date for Orient Technologies Ltd is 12 August 2026.

The next results date for Orient Technologies Ltd is scheduled for 12 August 2026.

View full answer

What is the bonus history of Orient Tech.?

02-Jan-2026

Orient Tech has announced a 1:10 bonus issue effective January 5, 2026, meaning shareholders will receive one additional share for every ten shares held. The record date and ex-date for this bonus are both January 5, 2026.

Orient Tech has a recent bonus history that includes a 1:10 bonus issue, which is set to take effect on January 5, 2026. This means that for every 10 shares held, shareholders will receive an additional share. The record date and ex-date for this bonus issue are both the same, January 5, 2026. If you have any more questions about Orient Tech or need further details, feel free to ask!

View full answer

How has been the historical performance of Orient Tech.?

13-Nov-2025

Orient Tech has shown significant growth over the past three years, with net sales increasing from 535.10 Cr in Mar'23 to 839.53 Cr in Mar'25, and profit after tax rising from 38.30 Cr to 50.44 Cr. Despite a decline in cash flow from operations, total assets and liabilities both grew substantially during this period.

Answer:<BR>The historical performance of Orient Tech shows significant growth over the past three years.<BR><BR>Breakdown:<BR>Orient Tech's net sales have increased from 535.10 Cr in Mar'23 to 602.89 Cr in Mar'24, and further to 839.53 Cr in Mar'25, indicating a strong upward trend. Total operating income followed the same pattern, reaching 839.53 Cr in Mar'25. The company's total expenditure also rose, from 486.46 Cr in Mar'23 to 771.93 Cr in Mar'25. Operating profit (PBDIT) grew from 55.55 Cr in Mar'23 to 74.36 Cr in Mar'25, while profit before tax increased from 51.95 Cr to 68.02 Cr in the same period. Consequently, profit after tax rose from 38.30 Cr in Mar'23 to 50.44 Cr in Mar'25. The earnings per share (EPS) improved from 10.94 in Mar'23 to 12.11 in Mar'25. On the balance sheet, total assets grew from 239.94 Cr in Mar'23 to 521.26 Cr in Mar'25, with total liabilities also increasing from 239.94 Cr to 521.26 Cr. The company's cash flow from operating activities showed a decline to -11.00 Cr in Mar'25, while cash flow from financing activities surged to 94.00 Cr, leading to a net cash inflow of 95.00 Cr by the end of Mar'25. Overall, Orient Tech has demonstrated robust growth in revenue and profitability, alongside a significant increase in assets and liabilities.

View full answer

Is Orient Tech. technically bullish or bearish?

04-Nov-2025

As of November 3, 2025, the trend is mildly bullish with positive indicators like a bullish MACD and signals from Bollinger Bands, but the lack of momentum in the RSI and mixed signals suggest a cautious outlook.

As of 3 November 2025, the technical trend has changed from bullish to mildly bullish. The current stance is mildly bullish, supported by a bullish MACD on the weekly timeframe and bullish signals from the Bollinger Bands and daily moving averages. However, the RSI shows no signal on both weekly and monthly timeframes, indicating a lack of momentum. Dow Theory and OBV show no trend, suggesting uncertainty in the longer-term outlook. Overall, while there are positive indicators, the lack of strong momentum and mixed signals implies a cautious bullish stance.

View full answer

Is Orient Tech. overvalued or undervalued?

09-Jun-2025

As of May 14, 2025, Orient Tech. is considered undervalued with an attractive valuation grade, featuring a PE ratio of 29.11 and an EV to EBITDA of 20.09, despite a year-to-date stock decline of -25.86% compared to the Sensex's 5.54%, making it a compelling investment opportunity relative to peers like Tata Consultancy Services and Infosys.

As of 14 May 2025, the valuation grade for Orient Tech. has moved from fair to attractive, indicating a positive shift in its perceived value. The company is currently considered undervalued. Key ratios include a PE ratio of 29.11, an EV to EBITDA of 20.09, and a ROCE of 28.41%. <BR><BR>In comparison to its peers, Tata Consultancy Services Ltd. has a PE ratio of 25.23 and an EV to EBITDA of 17.63, while Infosys Ltd. shows a PE ratio of 24.32 and an EV to EBITDA of 15.83. Despite a recent decline in stock performance year-to-date, where Orient Tech. has returned -25.86% compared to the Sensex's 5.54%, the overall valuation metrics suggest that the company presents a compelling investment opportunity relative to its peers.

View full answer

Who are the top shareholders of the Orient Tech.?

06-Jun-2025

The top shareholders of Orient Tech include promoters, with Ujwal Arvind Mhatre holding 18.25%, individual investors at 23.45%, and 17 foreign institutional investors with a total of 1.45%. There are no mutual funds or pledged promoter holdings in the company.

The top shareholders of Orient Tech are primarily the promoters, with Ujwal Arvind Mhatre holding the highest individual stake at 18.25%. Additionally, individual investors collectively own 23.45% of the company's shares. There are also 17 foreign institutional investors (FIIs) holding a total of 1.45%. Notably, there are no mutual funds currently holding shares in the company, and there are no pledged promoter holdings.

View full answer

Has Orient Tech. declared dividend?

06-Jun-2025

Yes, Orient Technologies Ltd has declared an 18% dividend, amounting to 1.8 per share, with an ex-date of November 22, 2024. However, total returns over the last 6 months are -17.4%, and there has been no growth in price or dividends over the past year to five years.

Orient Technologies Ltd has declared an 18% dividend.<BR><BR>Dividend Details:<BR>- Percentage announced: 18%<BR>- Amount per share: 1.8<BR>- Ex-date: 22 Nov 24<BR><BR>Dividend Yield: 0.51%.<BR><BR>Total Returns by Period:<BR>In the last 6 months, the price return was -17.4%, with no dividend return, resulting in a total return of -17.4%.<BR><BR>Over the past year, the price return was 0%, and there was no dividend return, leading to a total return of 0.0%.<BR><BR>For the 2-year period, the price return remained at 0%, with no dividend return, resulting in a total return of 0.0%.<BR><BR>In the 3-year period, the price return was 0%, and there was no dividend return, leading to a total return of 0.0%.<BR><BR>For the 4-year period, the price return stayed at 0%, with no dividend return, resulting in a total return of 0.0%.<BR><BR>In the last 5 years, the price return was 0%, and there was no dividend return, leading to a total return of 0.0%.<BR><BR>Overall, while Orient Technologies Ltd has declared a dividend, the total returns over various periods indicate a lack of growth, particularly in the short term, with significant negative returns in the last 6 months.

View full answer
iScoreScore
Click here to find our call on this stock
Strong Sell
Sell
Hold
Buy
Strong Buy

Dashboard

1

Poor long term growth as Operating profit has grown by an annual rate -37.92% of over the last 5 years

 
2

The company has declared Negative results for the last 3 consecutive quarters

3

With ROE of 6.3, it has a Very Expensive valuation with a 3.2 Price to Book Value

4

Despite the size of the company, domestic mutual funds hold only 0% of the company

5

Below par performance in long term as well as near term

stock-summaryMojo Parameters

Mojo Parameters

Loading Valuation Snapshot...

Stock DNA

stock-summary
Industry

Computers - Software & Consulting

stock-summary
Market cap

INR 1,091 Cr (Micro Cap)

stock-summary
P/E

52.00

stock-summary
Industry P/E

20

stock-summary
Dividend Yield

0.00%

stock-summary
Debt Equity

-0.03

stock-summary
Return on Equity

6.26%

stock-summary
Price to Book

3.24

Revenue and Profits:
Net Sales:
202 Cr
(Quarterly Results - Jun 2026)
Net Profit:
5 Cr
stock-summaryTotal Returns
Total Returns (Price + Dividend) stock-summary
Dividend Yield (0%)
TimePeriod
Price Return
Dividend Return
Total Return
3 Months
-8.43%
0%
-8.43%
6 Months
-11.97%
0%
-11.97%
1 Year
-25.41%
0%
-25.41%
2 Years
-14.31%
0.65%
-13.66%
3 Years
0%
0%
0.0%
4 Years
0%
0%
0.0%
5 Years
0%
0%
0.0%

Latest dividend: 1.6363599135479465 per share ex-dividend date: Nov-22-2024

Risk Adjusted Returns v/s stock-summary
Returns Beta
Icon
Beta has not been calculated since enough price history is not available
stock-summaryNews & Corporate Actions

Announcements stock-summary

Announcement under Regulation 30 (LODR)-Press Release / Media Release

10-Sep-2026 | Source : BSE

Press Release- Orient Technologies expands Cybersecurity Business with USD 3.25 Million Three year Securonix Contract Total Investment to reach approximately USD 5 Million.

Announcement under Regulation 30 (LODR)-Newspaper Publication

02-Sep-2026 | Source : BSE

Newspaper Publication informing completion of dispatch of Annual General Meeting Notice and Annual Report for the FY 2025-26 to the members.

Annual General Meeting To Be Held On September 23 2026

01-Sep-2026 | Source : BSE

29th Annual General Meeting of the company to be held on September 23 2026

Corporate Actions stock-summary

stock-summary
BOARD MEETING

No Upcoming Board Meetings

stock-summary
DIVIDEND

Orient Technologies Ltd has declared 18% dividend, ex-date: 22 Nov 24

stock-summary
SPLITS

No Splits history available

stock-summary
BONUS

Orient Technologies Ltd has announced 1:10 bonus issue, ex-date: 05 Jan 26

stock-summary
RIGHTS

No Rights history available

stock-summaryKey Factors

Quality key factors stock-summary

Factor
Value
Sales Growth (5y)
15.84%
EBIT Growth (5y)
-37.92%
EBIT to Interest (avg)
23.86
Debt to EBITDA (avg)
0.43
Net Debt to Equity (avg)
-0.03
Sales to Capital Employed (avg)
2.54
Tax Ratio
12.54%
Dividend Payout Ratio
14.86%
Pledged Shares
0.01%
Institutional Holding
0.05%
ROCE (avg)
27.67%
ROE (avg)
11.61%

Valuation key factors

Factor
Value
P/E Ratio
52
Industry P/E
20
Price to Book Value
3.24
EV to EBIT
51.06
EV to EBITDA
27.43
EV to Capital Employed
3.32
EV to Sales
1.26
PEG Ratio
NA
Dividend Yield
NA
ROCE (Latest)
8.69%
ROE (Latest)
6.26%

Technicals key factors

Indicator
Weekly
Monthly
MACD
Bearish
RSI
No Signal
No Signal
Bollinger Bands
Bearish
Bearish
Moving Averages
Bearish (Daily)
KST
Mildly Bullish
Dow Theory
No Trend
Mildly Bearish
OBV
No Trend
Bullish
stock-summary Technical Indicator Scale: Bearish, Mildly Bearish, Sideways, Mildly Bullish, Bullish  Turned 
stock-summaryShareholding
Shareholding Snapshot : Jun 2026stock-summary
Shareholding Compare (%holding) stock-summary
Majority shareholders

Promoters

Pledged Promoter Holdings

0.0052

Mutual Funds

Held by 0 Schemes

FIIs

Held by 4 FIIs (0.05%)

Promoter with highest holding

Ujwal Arvind Mhatre (17.61%)

Highest Public shareholder

Shrihari Kishor Bhat (2.58%)

Individual Investors Holdings

24.99%

stock-summaryFinancial
[
  {
    "link": "quarterly",
    "btn_text": "All Quarterly Results",
    "header": "Quarterly Results Snapshot (Standalone) - Jun'26 - QoQ",
    "rhs": [
      {
        "prefix": "Net Sales ",
        "suffix": "QoQ Growth in quarter ended Jun 2026 is 10.01% vs -8.53% in Mar 2026",
        "dir": 1
      },
      {
        "prefix": "Standalone Net Profit ",
        "suffix": "QoQ Growth in quarter ended Jun 2026 is 169.66% vs 56.82% in Mar 2026",
        "dir": 1
      }
    ],
    "table": {
      "header": [
        "Jun'26",
        "Mar'26",
        "Change(%)"
      ],
      "body": [
        {
          "field": "Net Sales",
          "val1": "199.49",
          "val2": "181.33",
          "chgp": "10.01%",
          "chgp_class": "positive"
        },
        {
          "field": "Operating Profit (PBDIT) excl Other Income",
          "val1": "12.81",
          "val2": "3.80",
          "chgp": "237.11%",
          "chgp_class": "positive"
        },
        {
          "field": "Interest",
          "val1": "1.80",
          "val2": "2.08",
          "chgp": "-13.46%",
          "chgp_class": "positive"
        },
        {
          "field": "Exceptional Items",
          "val1": "0.00",
          "val2": "-4.45",
          "chgp": "100.00%",
          "chgp_class": "positive"
        },
        {
          "field": "Standalone Net Profit",
          "val1": "4.50",
          "val2": "-6.46",
          "chgp": "169.66%",
          "chgp_class": "positive"
        },
        {
          "field": "Operating Profit Margin (Excl OI)",
          "val1": "6.42%",
          "val2": "2.10%",
          "chgp": "4.32%",
          "chgp_class": "positive"
        }
      ]
    }
  },
  {
    "link": "half-yearly",
    "btn_text": "All Half Yearly Results",
    "header": "Half Yearly Results Snapshot (Standalone) - Sep'25",
    "rhs": [
      {
        "prefix": "Net Sales ",
        "suffix": " Growth in half year ended Sep 2025 is 30.48% vs 39.68% in Sep 2024",
        "dir": -1
      },
      {
        "prefix": "Standalone Net Profit ",
        "suffix": " Growth in half year ended Sep 2025 is -0.58% vs 48.51% in Sep 2024",
        "dir": -1
      }
    ],
    "table": {
      "header": [
        "Sep'25",
        "Sep'24",
        "Change(%)"
      ],
      "body": [
        {
          "field": "Net Sales",
          "val1": "485.37",
          "val2": "371.99",
          "chgp": "30.48%",
          "chgp_class": "positive"
        },
        {
          "field": "Operating Profit (PBDIT) excl Other Income",
          "val1": "36.06",
          "val2": "31.98",
          "chgp": "12.76%",
          "chgp_class": "positive"
        },
        {
          "field": "Interest",
          "val1": "1.57",
          "val2": "0.54",
          "chgp": "190.74%",
          "chgp_class": "negative"
        },
        {
          "field": "Exceptional Items",
          "val1": "0.00",
          "val2": "0.00",
          "chgp": "",
          "chgp_class": "neutral"
        },
        {
          "field": "Standalone Net Profit",
          "val1": "24.20",
          "val2": "24.34",
          "chgp": "-0.58%",
          "chgp_class": "negative"
        },
        {
          "field": "Operating Profit Margin (Excl OI)",
          "val1": "7.43%",
          "val2": "8.60%",
          "chgp": "-1.17%",
          "chgp_class": "negative"
        }
      ]
    }
  },
  {
    "link": "nine-monthly",
    "btn_text": "All Nine Monthly Results",
    "header": "Nine Monthly Results Snapshot (Standalone) - Dec'25",
    "rhs": [
      {
        "prefix": "Net Sales ",
        "suffix": "YoY Growth in nine months ended Dec 2025 is 18.10% vs 37.22% in Dec 2024",
        "dir": -1
      },
      {
        "prefix": "Standalone Net Profit ",
        "suffix": "YoY Growth in nine months ended Dec 2025 is -75.03% vs 35.83% in Dec 2024",
        "dir": -1
      }
    ],
    "table": {
      "header": [
        "Dec'25",
        "Dec'24",
        "Change(%)"
      ],
      "body": [
        {
          "field": "Net Sales",
          "val1": "683.60",
          "val2": "578.85",
          "chgp": "18.10%",
          "chgp_class": "positive"
        },
        {
          "field": "Operating Profit (PBDIT) excl Other Income",
          "val1": "37.99",
          "val2": "48.36",
          "chgp": "-21.44%",
          "chgp_class": "negative"
        },
        {
          "field": "Interest",
          "val1": "3.04",
          "val2": "1.10",
          "chgp": "176.36%",
          "chgp_class": "negative"
        },
        {
          "field": "Exceptional Items",
          "val1": "-19.24",
          "val2": "0.00",
          "chgp": "",
          "chgp_class": "neutral"
        },
        {
          "field": "Standalone Net Profit",
          "val1": "9.24",
          "val2": "37.00",
          "chgp": "-75.03%",
          "chgp_class": "negative"
        },
        {
          "field": "Operating Profit Margin (Excl OI)",
          "val1": "5.56%",
          "val2": "8.35%",
          "chgp": "-2.79%",
          "chgp_class": "negative"
        }
      ]
    }
  },
  {
    "link": "annual",
    "btn_text": "All Annual Results",
    "header": "Annual Results Snapshot (Standalone) - Mar'26",
    "rhs": [
      {
        "prefix": "Net Sales ",
        "suffix": "YoY Growth in year ended Mar 2026 is 3.03% vs 39.25% in Mar 2025",
        "dir": -1
      },
      {
        "prefix": "Standalone Net Profit ",
        "suffix": "YoY Growth in year ended Mar 2026 is -94.47% vs 21.69% in Mar 2025",
        "dir": -1
      }
    ],
    "table": {
      "header": [
        "Mar'26",
        "Mar'25",
        "Change(%)"
      ],
      "body": [
        {
          "field": "Net Sales",
          "val1": "864.93",
          "val2": "839.53",
          "chgp": "3.03%",
          "chgp_class": "positive"
        },
        {
          "field": "Operating Profit (PBDIT) excl Other Income",
          "val1": "41.79",
          "val2": "67.60",
          "chgp": "-38.18%",
          "chgp_class": "negative"
        },
        {
          "field": "Interest",
          "val1": "5.12",
          "val2": "1.22",
          "chgp": "319.67%",
          "chgp_class": "negative"
        },
        {
          "field": "Exceptional Items",
          "val1": "-23.68",
          "val2": "0.00",
          "chgp": "",
          "chgp_class": "neutral"
        },
        {
          "field": "Standalone Net Profit",
          "val1": "2.79",
          "val2": "50.44",
          "chgp": "-94.47%",
          "chgp_class": "negative"
        },
        {
          "field": "Operating Profit Margin (Excl OI)",
          "val1": "4.83%",
          "val2": "8.05%",
          "chgp": "-3.22%",
          "chgp_class": "negative"
        }
      ]
    }
  }
]

Quarterly Results Snapshot (Standalone) - Jun'26 - QoQstock-summary

Jun'26
Mar'26
Change(%)
Net Sales
199.49
181.33
10.01%
Operating Profit (PBDIT) excl Other Income
12.81
3.80
237.11%
Interest
1.80
2.08
-13.46%
Exceptional Items
0.00
-4.45
100.00%
Standalone Net Profit
4.50
-6.46
169.66%
Operating Profit Margin (Excl OI)
6.42%
2.10%
4.32%
Values in Rs Cr.
Direction Arrows
Net Sales

QoQ Growth in quarter ended Jun 2026 is 10.01% vs -8.53% in Mar 2026

Direction Arrows
Standalone Net Profit

QoQ Growth in quarter ended Jun 2026 is 169.66% vs 56.82% in Mar 2026

Half Yearly Results Snapshot (Standalone) - Sep'25stock-summary

Sep'25
Sep'24
Change(%)
Net Sales
485.37
371.99
30.48%
Operating Profit (PBDIT) excl Other Income
36.06
31.98
12.76%
Interest
1.57
0.54
190.74%
Exceptional Items
0.00
0.00
Standalone Net Profit
24.20
24.34
-0.58%
Operating Profit Margin (Excl OI)
7.43%
8.60%
-1.17%
Values in Rs Cr.
Direction Arrows
Net Sales

Growth in half year ended Sep 2025 is 30.48% vs 39.68% in Sep 2024

Direction Arrows
Standalone Net Profit

Growth in half year ended Sep 2025 is -0.58% vs 48.51% in Sep 2024

Nine Monthly Results Snapshot (Standalone) - Dec'25stock-summary

Dec'25
Dec'24
Change(%)
Net Sales
683.60
578.85
18.10%
Operating Profit (PBDIT) excl Other Income
37.99
48.36
-21.44%
Interest
3.04
1.10
176.36%
Exceptional Items
-19.24
0.00
Standalone Net Profit
9.24
37.00
-75.03%
Operating Profit Margin (Excl OI)
5.56%
8.35%
-2.79%
Values in Rs Cr.
Direction Arrows
Net Sales

YoY Growth in nine months ended Dec 2025 is 18.10% vs 37.22% in Dec 2024

Direction Arrows
Standalone Net Profit

YoY Growth in nine months ended Dec 2025 is -75.03% vs 35.83% in Dec 2024

Annual Results Snapshot (Standalone) - Mar'26stock-summary

Mar'26
Mar'25
Change(%)
Net Sales
864.93
839.53
3.03%
Operating Profit (PBDIT) excl Other Income
41.79
67.60
-38.18%
Interest
5.12
1.22
319.67%
Exceptional Items
-23.68
0.00
Standalone Net Profit
2.79
50.44
-94.47%
Operating Profit Margin (Excl OI)
4.83%
8.05%
-3.22%
Values in Rs Cr.
Direction Arrows
Net Sales

YoY Growth in year ended Mar 2026 is 3.03% vs 39.25% in Mar 2025

Direction Arrows
Standalone Net Profit

YoY Growth in year ended Mar 2026 is -94.47% vs 21.69% in Mar 2025

stock-summaryCompany CV
About Orient Technologies Ltd stock-summary
stock-summary
Orient Technologies Ltd
Micro Cap
Computers - Software & Consulting
Orient Technologies Ltd formerly incorporated as a Private Limited Company in the name of Orient Technologies Private Limited' at Mumbai on July 04, 1997 was converted into Public Limited Company and the name of the Company was changed to `Orient Technologies Limited', pursuant to a fresh certificate of incorporation issued by the RoC on October 12, 2023.
Company Coordinates stock-summary
Icon
No Company Details Available