
Compare Oswal Pumps with Similar Stocks
Dashboard
High Management Efficiency with a high ROCE of 53.89%
Strong ability to service debt as the company has a low Debt to EBITDA ratio of 0.18 times
Healthy long term growth as Net Sales has grown by an annual rate of 64.30% and Operating profit at 165.63%
The company has declared Positive results for the last 4 consecutive quarters
With ROE of 22.4, it has a Very Attractive valuation with a 2.9 Price to Book Value
Stock DNA
Compressors, Pumps & Diesel Engines
INR 4,805 Cr (Small Cap)
13.00
33
0.00%
-0.09
22.41%
2.69
Total Returns (Price + Dividend) 
Oswal Pumps for the last several years.
Risk Adjusted Returns v/s
Returns Beta

News
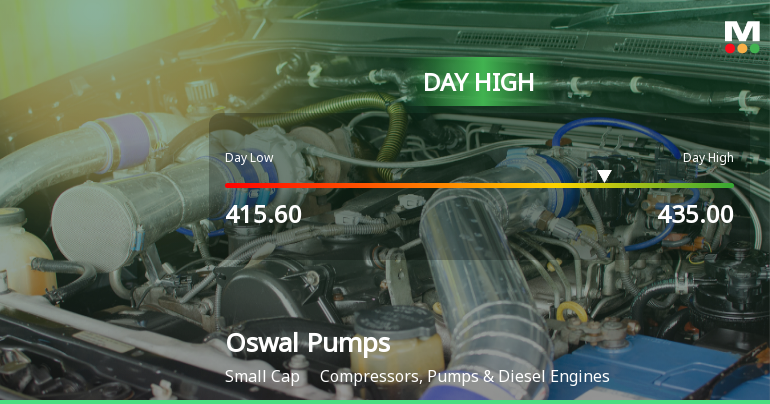
Oswal Pumps Ltd Surges 7.03% to Day's High of Rs 434 — Outperforms Sector by 6.74 Percentage Points
The Sensex advanced 1.43% on 15 Jun 2026, yet Oswal Pumps Ltd outpaced the broader market with a robust 7.03% gain, reaching an intraday high of Rs 434. This 6.74-percentage-point outperformance over its sector highlights a distinctly stock-specific rally rather than a mere market tailwind.
Read full news article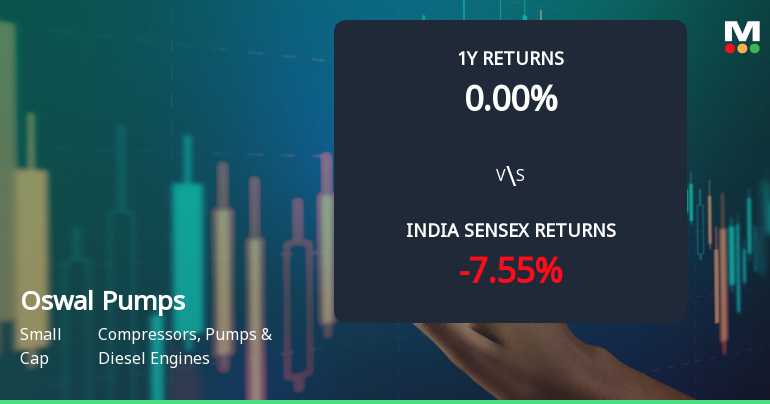
Oswal Pumps Ltd Technical Momentum Shifts Signal Mildly Bullish Outlook
Oswal Pumps Ltd has exhibited a notable shift in its technical momentum, transitioning from a mildly bearish stance to a mildly bullish outlook. This change is underscored by improvements in key technical indicators such as the MACD and Bollinger Bands on the weekly chart, alongside a recent upgrade in its Mojo Grade from Hold to Buy, reflecting growing investor confidence in this small-cap player within the Compressors, Pumps & Diesel Engines sector.
Read full news article
Oswal Pumps Ltd Technical Momentum Shifts Amid Market Pressure
Oswal Pumps Ltd, a small-cap player in the Compressors, Pumps & Diesel Engines sector, has experienced a notable shift in its technical momentum, moving from a mildly bullish to a mildly bearish stance. This change comes amid a significant price correction, with the stock falling 3.52% on 12 Jun 2026, reflecting broader market pressures and evolving technical indicators.
Read full news article Announcements
Announcement under Regulation 30 (LODR)-Press Release / Media Release
14-Jun-2026 | Source : BSEAs per attached intimation letter.
Announcement under Regulation 30 (LODR)-Award_of_Order_Receipt_of_Order
14-Jun-2026 | Source : BSEAs per attached intimation letter.
Announcement under Regulation 30 (LODR)-Analyst / Investor Meet - Intimation
09-Jun-2026 | Source : BSEAs per attached intimation letter
Corporate Actions

No Upcoming Board Meetings

No Dividend history available

No Splits history available

No Bonus history available

No Rights history available
Quality key factors
Valuation key factors
Technicals key factors
 Technical Indicator Scale: Bearish, Mildly Bearish, Sideways, Mildly Bullish, Bullish Turned
 Shareholding Snapshot : Mar 2026
Shareholding Compare (%holding)
Promoters
None
Held by 10 Schemes (4.49%)
Held by 11 FIIs (0.85%)
Shorya Trading Company Private Limited (47.84%)
Quant Mutual Fund - Quant Small Cap Fund (1.68%)
12.66%
Quarterly Results Snapshot (Consolidated) - Mar'26 - QoQ

QoQ Growth in quarter ended Mar 2026 is 1.73% vs -7.15% in Dec 2025
QoQ Growth in quarter ended Mar 2026 is 1.06% vs -6.09% in Dec 2025
Half Yearly Results Snapshot (Standalone) - Sep'25
Not Applicable: The company has declared_date for only one period
Not Applicable: The company has declared_date for only one period
Nine Monthly Results Snapshot (Standalone) - Dec'25
Not Applicable: The company has declared_date for only one period
Not Applicable: The company has declared_date for only one period
Annual Results Snapshot (Consolidated) - Mar'26

YoY Growth in year ended Mar 2026 is 44.33% vs 88.55% in Mar 2025
YoY Growth in year ended Mar 2026 is 34.09% vs 187.30% in Mar 2025
About Oswal Pumps Ltd

Company Coordinates


