
Compare P. H. Capital with Similar Stocks
Stock DNA
Non Banking Financial Company (NBFC)
INR 278 Cr (Micro Cap)
85.00
20
0.00%
0.00
5.63%
4.83
Total Returns (Price + Dividend) 
Latest dividend: 0.2 per share ex-dividend date: Apr-04-2025
Risk Adjusted Returns v/s
Returns Beta

News

P. H. Capital Ltd is Rated Sell by MarketsMOJO
P. H. Capital Ltd is rated 'Sell' by MarketsMOJO, with this rating last updated on 23 April 2026. However, the analysis and financial metrics discussed here reflect the stock's current position as of 11 June 2026, providing investors with an up-to-date view of the company’s fundamentals, valuation, financial trends, and technical outlook.
Read full news article
Broad-Based Technical Strength Lifts P. H. Capital Ltd to 52-Week High of Rs 944
Surging to an all-time high of Rs 944 on 10 Jun 2026, P. H. Capital Ltd has demonstrated remarkable price momentum, outperforming its sector and the broader market with a 26.17% gain over the past 14 trading days. This milestone caps a spectacular 400.40% rally over the past year, dwarfing the Sensex’s 10.10% decline during the same period.
Read full news article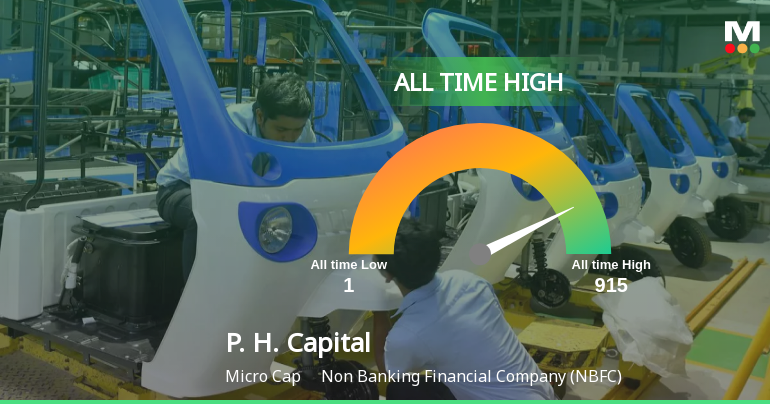
P. H. Capital Ltd Hits All-Time High of Rs 915 as Momentum Builds Across Timeframes
Extending a remarkable winning streak to 14 sessions, P. H. Capital Ltd touched a fresh all-time high of Rs 915 on 10 Jun 2026, marking a 22.82% gain over this period and significantly outpacing the broader market indices.
Read full news article Announcements
Disclosures under Reg. 29(1) of SEBI (SAST) Regulations 2011
10-Jun-2026 | Source : BSEThe Exchange has received the disclosure under Regulation 29(1) of SEBI (Substantial Acquisition of Shares & Takeovers) Regulations 2011 for Aditya Himmat Bhansali
Post-Offer Advertisement
09-Jun-2026 | Source : BSEChoice Capital Advisors Pvt Ltd (Manager to the Offer) has submitted to BSE a copy of Post-Offer Advertisement to the public shareholders of PH Capital Ltd (Target Company).
Intimation Of Re-Classification Of Promoters Pursuant To The Open Offer Under SEBI (SAST) Regulations 2011 In Accordance With Regulation 31A(10)(Ii) Of The SEBI (LODR) Regulations 2015
08-Jun-2026 | Source : BSEPlease find enclosed as per the subject.
Corporate Actions

No Upcoming Board Meetings

P. H. Capital Ltd has declared 2% dividend, ex-date: 04 Apr 25

No Splits history available

No Bonus history available

No Rights history available
Quality key factors
Valuation key factors
Technicals key factors
 Technical Indicator Scale: Bearish, Mildly Bearish, Sideways, Mildly Bullish, Bullish Turned
 Shareholding Snapshot : Mar 2026
Shareholding Compare (%holding)
Promoters
None
Held by 0 Schemes
Held by 2 FIIs (1.89%)
Ruby Multimedia Private Limited (18.0%)
Perdu Petrochemicals Trading L.l.c (1.33%)
21.11%
Quarterly Results Snapshot (Standalone) - Mar'26 - QoQ

QoQ Growth in quarter ended Mar 2026 is 1,329.68% vs -95.00% in Dec 2025
QoQ Growth in quarter ended Mar 2026 is -26.98% vs -40.00% in Dec 2025
Half Yearly Results Snapshot (Standalone) - Sep'25

Growth in half year ended Sep 2025 is 14.91% vs 16.39% in Sep 2024
Growth in half year ended Sep 2025 is -51.16% vs 8.42% in Sep 2024
Nine Monthly Results Snapshot (Standalone) - Dec'25
YoY Growth in nine months ended Dec 2025 is -40.47% vs 57.70% in Dec 2024
YoY Growth in nine months ended Dec 2025 is -66.76% vs -29.46% in Dec 2024
Annual Results Snapshot (Standalone) - Mar'26
YoY Growth in year ended Mar 2026 is -39.25% vs 14.98% in Mar 2025
YoY Growth in year ended Mar 2026 is -58.73% vs -61.00% in Mar 2025
About P. H. Capital Ltd


