
Compare P N Gadgil Jewe. with Similar Stocks
Dashboard
High Management Efficiency with a high ROE of 17.53%
Company has a Debt to Equity ratio (avg) of 0.44 times
Healthy long term growth as Net Sales has grown by an annual rate of 32.41% and Operating profit at 50.63%
The company has declared Positive results for the last 3 consecutive quarters
With ROCE of 16.9, it has a Attractive valuation with a 3.2 Enterprise value to Capital Employed
Stock DNA
Gems, Jewellery And Watches
INR 8,956 Cr (Small Cap)
20.00
55
0.00%
0.63
21.01%
4.58
Total Returns (Price + Dividend) 
P N Gadgil Jewe. for the last several years.
Risk Adjusted Returns v/s
Returns Beta

News

P N Gadgil Jewellers Ltd Upgraded to Buy on Improved Fundamentals and Technicals
P N Gadgil Jewellers Ltd has seen its investment rating upgraded from Hold to Buy, driven by a combination of improved technical indicators, attractive valuation metrics, robust financial trends, and solid quality fundamentals. This upgrade reflects the company’s strong market performance and favourable outlook within the Gems, Jewellery and Watches sector.
Read full news article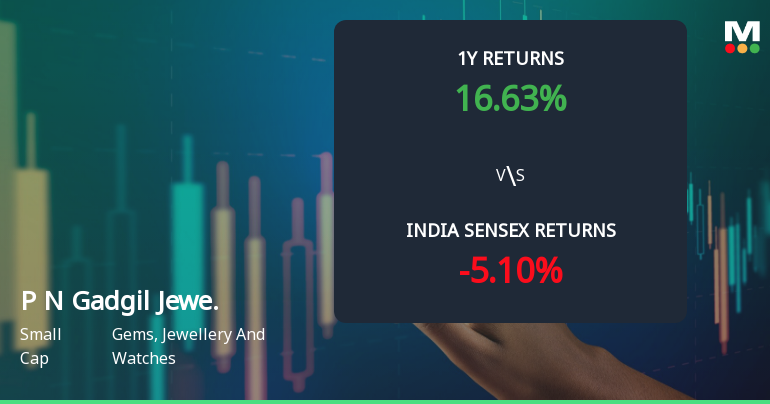
P N Gadgil Jewellers Ltd Technical Momentum Shifts Signal Bullish Outlook
P N Gadgil Jewellers Ltd has exhibited a notable shift in its technical momentum, transitioning from a sideways trend to a mildly bullish stance. Despite a minor dip in the latest session, key indicators such as MACD and Bollinger Bands on weekly and monthly charts suggest improving price strength, while moving averages and KST oscillators present a more nuanced picture. This article analyses the recent technical developments, price action, and relative performance against the Sensex to provide a comprehensive outlook for investors.
Read full news articleAre P N Gadgil Jewellers Ltd latest results good or bad?
P N Gadgil Jewellers Ltd has reported its financial results for the quarter ending June 2026, showcasing a significant year-on-year growth in net sales and net profit. The company achieved net sales of ₹2,412.98 crores, reflecting a year-on-year increase of 40.73%. This growth indicates the company's effective strategy in capturing market share across both established and new markets. Additionally, the operating profit margin expanded to 7.56%, marking the highest quarterly margin in recent periods, which highlights improved operational efficiency and pricing power in a challenging gold price environment. The net profit for the quarter was ₹105.34 crores, representing a 51.92% increase compared to the same quarter last year. This growth in profit outpaced revenue growth, suggesting positive operating leverage and effective cost management. On a sequential basis, while net sales saw a decline of 31.92% comp...
Read full news article Announcements
Corporate Actions

No Upcoming Board Meetings

No Dividend history available

No Splits history available

No Bonus history available

No Rights history available
Quality key factors
Valuation key factors
Technicals key factors
 Technical Indicator Scale: Bearish, Mildly Bearish, Sideways, Mildly Bullish, Bullish Turned
 Shareholding Snapshot : Jun 2026
Shareholding Compare (%holding)
Promoters
None
Held by 8 Schemes (4.52%)
Held by 19 FIIs (0.49%)
Svg Business Trust (radhika Saurabh Gadgil) (83.11%)
Bandhan Mutual Fund (2%)
10.15%
Quarterly Results Snapshot (Consolidated) - Jun'26 - QoQ

QoQ Growth in quarter ended Jun 2026 is -31.92% vs 7.32% in Mar 2026

QoQ Growth in quarter ended Jun 2026 is 16.71% vs -47.19% in Mar 2026
Half Yearly Results Snapshot (Consolidated) - Sep'25
Growth in half year ended Sep 2025 is 6.07% vs 39.61% in Sep 2024
Growth in half year ended Sep 2025 is 111.63% vs 59.27% in Sep 2024
Nine Monthly Results Snapshot (Consolidated) - Dec'25
YoY Growth in nine months ended Dec 2025 is 17.85% vs 32.71% in Dec 2024
YoY Growth in nine months ended Dec 2025 is 104.48% vs 53.67% in Dec 2024
Annual Results Snapshot (Consolidated) - Mar'26
YoY Growth in year ended Mar 2026 is 39.59% vs 25.87% in Mar 2025
YoY Growth in year ended Mar 2026 is 87.76% vs 40.68% in Mar 2025
About P N Gadgil Jewellers Ltd

Company Coordinates


