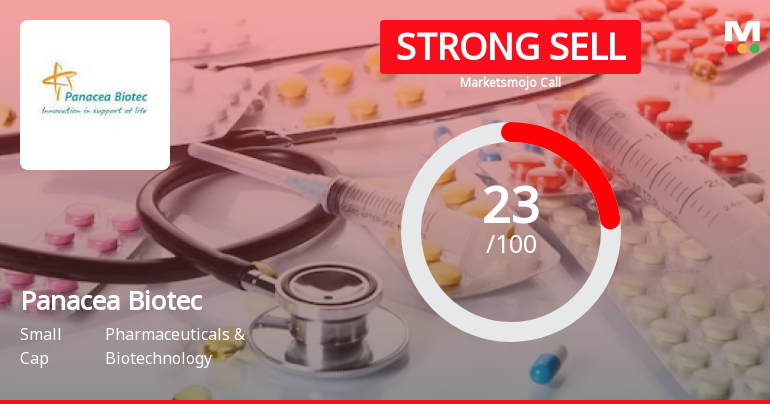
Panacea Biotec

  • Market Cap: Small Cap
  • Industry: Pharmaceuticals & Biotechnology
  • ISIN: INE922B01023
  • NSEID: PANACEABIO
  • BSEID: 531349
INR
383.70
7.85 (2.09%)
BSENSE

Sep 22, 03:30 PM

BSE+NSE Vol: 1.54 lacs

  • Price Points
  • Score
  • Mojo Parameters
  • Total Return
  • News and Corporate Actions
  • Key factors
  • Shareholding
  • Financials
  • CompanyCV
stock-summaryPrice Point
High/Low

1Day

52 Week

Valuation
Technical
Day's Volume

CASH

1.54 lacs (43.16%) Volume

Shareholding (Jun 2026)

FII

2.31%

Held by 16 FIIs

DII

2.25%

Held by 0 DIIs

Promoter

72.48%

Which are the latest news on Panacea Biotec?

22-Sep-2026

Why is Panacea Biotec Ltd falling/rising?

06-Sep-2026

As of 05-Sep, Panacea Biotec Ltd's stock price is declining at Rs 381.20, down 2.09%, with bearish trends indicated by trading below key moving averages and reduced investor participation. Despite some positive sales growth, weak long-term fundamentals and a negative EBIT raise concerns about the company's financial health.

As of 05-Sep, Panacea Biotec Ltd's stock price is falling, currently at Rs 381.20, reflecting a decrease of Rs 8.15 or 2.09%. The stock has underperformed the sector by 1.63% today and has touched an intraday low of Rs 380.1, indicating a decline of 2.38%. Additionally, the stock is trading below its 5-day, 20-day, 50-day, 100-day, and 200-day moving averages, which suggests a bearish trend.<BR><BR>Investor participation has also decreased, with delivery volume dropping by 34.78% compared to the 5-day average, indicating reduced interest from retail investors. While there have been positive developments such as a 22.42% growth in net sales over the last six months and an increase in institutional investor stakes, the overall sentiment remains negative due to weak long-term fundamentals. The company has a concerning average Return on Equity (ROE) of 0% and has recorded a negative EBIT of Rs -30.38 crore, which raises concerns about its ability to service debt.<BR><BR>In summary, the combination of poor price performance, declining investor participation, and weak long-term financial health contributes to the falling stock price of Panacea Biotec Ltd.

View full answer

Who are in the management team of Panacea Biotec?

01-Sep-2026

The management team of Panacea Biotec includes Chairman & Executive Director Soshil Kumar Jain, Managing Director Rajesh Jain, Joint Managing Director Sandeep Jain, Group CFO Vinod Goel, and Whole-time Director Ankesh Jain, along with several non-executive and independent directors. Narotam Kumar Juneja also serves as a director, collectively guiding the company's strategic direction and operations.

The management team of Panacea Biotec includes the following key members:<BR><BR>1. **Soshil Kumar Jain** - Chairman & Executive Director<BR>2. **Rajesh Jain** - Chairman & Managing Director<BR>3. **Sandeep Jain** - Joint Managing Director<BR>4. **Vinod Goel** - Group CFO & Company Secretary<BR>5. **Ankesh Jain** - Whole-time Director<BR><BR>Additionally, the board includes several non-executive and independent directors:<BR>- **R L Narasimhan**<BR>- **N N Khamitkar**<BR>- **K M Lal**<BR>- **Manjula Upadhyay**<BR>- **Mukul Gupta**<BR>- **Bhupinder Singh**<BR><BR>Lastly, **Narotam Kumar Juneja** serves as a director. This team plays a crucial role in guiding the company's strategic direction and operations.

View full answer

What does Panacea Biotec do?

01-Sep-2026

Panacea Biotec Ltd is a leading Indian health management company in the Pharmaceuticals & Biotechnology sector, with a market cap of INR 2,392 Cr. As of June 2026, it reported net sales of 200 Cr and a net profit of 2 Cr.

Overview:<BR>Panacea Biotec Ltd is India's leading research-based health management company operating in the Pharmaceuticals & Biotechnology industry within the Small Cap market-cap bracket.<BR><BR>History:<BR>The company was incorporated on February 2, 1984, originally under the name Panacea Drug (P) Ltd. The latest quarterly results reported net sales and profit for June 2026.<BR><BR>Financial Snapshot:<BR>Net Sales: 200 Cr (Quarterly Results - Jun 2026) <BR>Net Profit: 2 Cr (Quarterly Results - Jun 2026) <BR>Market cap: INR 2,392 Cr (Small Cap)<BR><BR>Key Metrics:<BR>P/E: N/A <BR>Industry P/E: 37 <BR>Dividend Yield: 0.00% <BR>Debt Equity: -0.06 <BR>Return on Equity: -2.31% <BR>Price to Book: 2.89<BR><BR>Contact Details:<BR>Address: Ambala-Chandigarh Highway, Lalru Punjab: 140501 <BR>Tel: 91-1762-505900 <BR>Email: companysec@panaceabiotec.com <BR>Website: http://www.panaceabiotec.com

View full answer

Who are the peers of the Panacea Biotec?

01-Sep-2026

Panacea Biotec's peers include Solara Active, Dishman Carbogen, Hikal, Fredun Pharma, Indoco Remedies, Venus Remedies, Windlas Biotech, Beta Drugs Ltd, and Sakar Healthcare. Fredun Pharma leads in 1-year returns at 279%, while Panacea Biotec has a return of -9.67%.

Peers: The peers of Panacea Biotec are Solara Active, Dishman Carbogen, Hikal, Fredun Pharma, Indoco Remedies, Venus Remedies, Windlas Biotech, Beta Drugs Ltd, and Sakar Healthcare.<BR><BR>Quality Snapshot: Below Average management risk is observed at Solara Active, Dishman Carbogen, and Panacea Biotec, while Average management risk is found at Hikal, Indoco Remedies, Venus Remedies, Windlas Biotech, Beta Drugs Ltd, Sakar Healthcare, and the rest. Growth is Excellent at Fredun Pharma, Good at Dishman Carbogen and Venus Remedies, Average at Beta Drugs Ltd and Sakar Healthcare, and Below Average at Solara Active, Hikal, Panacea Biotec, Indoco Remedies, Windlas Biotech, and the rest. Capital Structure is Excellent at Venus Remedies and Windlas Biotech, Below Average at Solara Active, Dishman Carbogen, Hikal, Fredun Pharma, Panacea Biotec, and Indoco Remedies, and Average at Beta Drugs Ltd and Sakar Healthcare.<BR><BR>Return Snapshot: The peer with the highest 1-year return is Fredun Pharma at 279.00%, while Dishman Carbogen has the lowest at -32.34%. Panacea Biotec's own 1-year return is -9.67%, which is higher than Dishman Carbogen's but lower than Fredun Pharma's. Additionally, Beta Drugs Ltd and Sakar Healthcare have a six-month return of 0.00%.

View full answer

How big is Panacea Biotec?

01-Sep-2026

As of 31st August, Panacea Biotec Ltd has a market capitalization of 2,392.00 Cr, with net sales of 672.64 Cr and a net loss of 7.12 Cr over the latest four quarters. Shareholder's funds are 834.79 Cr, and total assets are valued at 1,289.75 Cr.

As of 31st August, Panacea Biotec Ltd has a market capitalization of 2,392.00 Cr, classifying it as a Small Cap company.<BR><BR>In the latest four quarters, the company reported net sales of 672.64 Cr. However, it experienced a loss of 7.12 Cr in net profit during the same period.<BR><BR>The latest annual reporting period for the balance sheet is March 2025. Shareholder's funds stood at 834.79 Cr, while total assets were valued at 1,289.75 Cr.

View full answer

Should I buy, sell or hold Panacea Biotec Ltd?

25-Aug-2026

Are Panacea Biotec Ltd latest results good or bad?

02-Jun-2026

Panacea Biotec Ltd's latest Q4 FY26 results show a 25.82% increase in net sales to ₹166.75 crores, but the company reported a net loss of ₹1.00 crore, reflecting significant profitability challenges and a sharp decline in operating margins. Overall, while revenue growth is positive, the inability to achieve profitability raises concerns about the company's structural weaknesses.

Panacea Biotec Ltd's latest results for Q4 FY26 indicate a challenging situation for the company. While net sales reached ₹166.75 crores, marking a 25.82% increase year-on-year and an all-time quarterly high, the company reported a net loss of ₹1.00 crore. This represents a significant decline of 86.93% quarter-on-quarter and a staggering 127.51% year-on-year deterioration in profitability.<BR><BR>The operating margin saw a dramatic collapse, falling to just 1.54% from 7.11% in the previous quarter, highlighting severe cost pressures that overshadowed the revenue growth. This marks the third quarterly loss in the past eight quarters, underscoring persistent operational challenges.<BR><BR>Overall, while the revenue growth is a positive sign, the inability to translate that into profitability, combined with the sharp decline in margins, paints a concerning picture for Panacea Biotec. The results suggest that the company is facing significant structural weaknesses that need to be addressed for a turnaround.

View full answer

When is the next results date for Panacea Biotec Ltd?

27-May-2026

The next results date for Panacea Biotec Ltd is 30 May 2026.

The next results date for Panacea Biotec Ltd is scheduled for 30 May 2026.

View full answer

Is Panacea Biotec technically bullish or bearish?

02-Dec-2025

As of December 1, 2025, Panacea Biotec's technical trend is bearish, supported by bearish signals from the weekly MACD and KST, daily moving averages, and a lack of strong indicators from the RSI and Dow Theory, despite mildly bullish monthly Bollinger Bands.

As of 1 December 2025, the technical trend has changed from mildly bearish to bearish. The current technical stance for Panacea Biotec is bearish, with a moderate strength indicated by the weekly MACD and KST both showing bearish signals. The daily moving averages also confirm a bearish outlook. Although the monthly Bollinger Bands are mildly bullish, they do not outweigh the bearish indicators present in the weekly timeframe. Overall, the lack of significant signals from the RSI and Dow Theory further supports a bearish sentiment.

View full answer

How has been the historical performance of Panacea Biotec?

15-Nov-2025

Panacea Biotec's historical performance shows fluctuating financial metrics, with stable net sales but increasing operating losses, resulting in a decline in profit before and after tax. Despite a slight increase in total assets and improved cash flow from investing activities, the company faces challenges in profitability.

Answer:<BR>The historical performance of Panacea Biotec shows a fluctuating trend in its financial metrics over the years.<BR><BR>Breakdown:<BR>Panacea Biotec's net sales have remained relatively stable, with a slight decrease from 559.17 crore in March 2024 to 559.09 crore in March 2025, following a notable drop from 661.23 crore in March 2022. The total operating income mirrored this trend, peaking at 661.23 crore in March 2022 before declining to 559.09 crore in March 2025. The company's total expenditure, excluding depreciation, increased from 579.23 crore in March 2024 to 585.00 crore in March 2025, contributing to an operating loss of 25.91 crore in March 2025, compared to a loss of 20.06 crore in March 2024. Profit before tax also saw a decline, moving from a profit of 1.48 crore in March 2024 to a loss of 7.95 crore in March 2025. Consequently, the profit after tax worsened from a loss of 1.50 crore in March 2024 to a loss of 8.72 crore in March 2025. The company's total assets increased slightly from 1,240.82 crore in March 2024 to 1,289.75 crore in March 2025, while total liabilities also rose from 1,240.82 crore to 1,289.75 crore during the same period. Cash flow from operating activities remained negative at -27.00 crore in March 2025, although cash flow from investing activities improved significantly to 64.00 crore. Overall, the financial performance of Panacea Biotec reflects challenges in profitability despite stable revenue figures.

View full answer

Who are the top shareholders of the Panacea Biotec?

17-Jul-2025

The top shareholder of Panacea Biotec is Dr. Rajesh Jain, who holds 49.33% of the shares. Individual investors own 18.45%, while 14 foreign institutional investors hold a combined 1.16%, with no mutual funds currently invested.

The top shareholders of Panacea Biotec include the promoters, with Dr. Rajesh Jain holding the highest stake at 49.33%. There are no pledged promoter holdings, and individual investors collectively hold 18.45% of the shares. Additionally, 14 foreign institutional investors (FIIs) hold a combined 1.16% of the company. There are no mutual funds currently holding shares in Panacea Biotec.

View full answer

Is Panacea Biotec overvalued or undervalued?

09-Jun-2025

As of November 13, 2020, Panacea Biotec is considered risky and overvalued with a negative PE ratio of -61.96 and an EV to EBITDA of -103.02, significantly worse than its peers, despite a 252.56% return over the past year.

As of 13 November 2020, the valuation grade for Panacea Biotec has moved from very expensive to risky, indicating a significant shift in its perceived value. The company is currently assessed as overvalued, given its negative PE ratio of -61.96 and EV to EBITDA ratio of -103.02, which are starkly contrasting with its peers. The Price to Book Value stands at 3.30, suggesting that the market is pricing the company at a premium despite its financial struggles.<BR><BR>In comparison to its peers, Panacea Biotec's ratios are considerably worse; for instance, Sun Pharma has a PE ratio of 35.25 and an EV to EBITDA of 24.91, while Cipla shows a PE of 22.99 and an EV to EBITDA of 15.93. These comparisons highlight the challenges Panacea Biotec faces in the market. Additionally, while the company has shown impressive returns over the past year at 252.56%, this performance is not enough to justify its current valuation in light of its financial metrics.

View full answer

Has Panacea Biotec declared dividend?

06-Jun-2025

Yes, Panacea Biotec Ltd has declared a 75% dividend, amounting to ₹0.75 per share, with an ex-date of September 19, 2011. However, the dividend yield is 0%, as it has not contributed to returns in recent periods, despite significant price returns.

Panacea Biotec Ltd has declared a 75% dividend.<BR><BR>Dividend Details:<BR>- Percentage announced: 75%<BR>- Amount per share: 0.75<BR>- Ex-date: 19 Sep 11<BR><BR>Dividend Yield: 0%<BR><BR>Total Returns by Period:<BR>In the 6-month period, the price return was 2.49%, the dividend return was 0%, resulting in a total return of 2.49%.<BR><BR>For the 1-year period, the price return was 253.27%, the dividend return was 0%, leading to a total return of 253.27%.<BR><BR>Over the 2-year period, the price return was 272.84%, with a dividend return of 0%, culminating in a total return of 272.84%.<BR><BR>In the 3-year period, the price return was 203.06%, the dividend return was 0%, resulting in a total return of 203.06%.<BR><BR>For the 4-year period, the price return was 15.05%, with a dividend return of 0%, leading to a total return of 15.05%.<BR><BR>In the 5-year period, the price return was 177.17%, the dividend return was 0%, culminating in a total return of 177.17%.<BR><BR>Overall, while Panacea Biotec has declared a dividend, the dividend yield is 0%, indicating that the dividend has not contributed to returns in recent periods. The company has experienced significant price returns over various periods, suggesting strong performance in its stock value.

View full answer
iScoreScore
Click here to find our call on this stock
Strong Sell
Sell
Hold
Buy
Strong Buy

Dashboard

1

Weak Long Term Fundamental Strength with a -233.29% CAGR growth in Operating Profits over the last 5 years

  • Company's ability to service its debt is weak with a poor EBIT to Interest (avg) ratio of -10.27
2

Risky - Negative Operating Profits

stock-summaryMojo Parameters

Mojo Parameters

Loading Valuation Snapshot...

Stock DNA

stock-summary
Industry

Pharmaceuticals & Biotechnology

stock-summary
Market cap

INR 2,406 Cr (Small Cap)

stock-summary
P/E

NA (Loss Making)

stock-summary
Industry P/E

38

stock-summary
Dividend Yield

0.00%

stock-summary
Debt Equity

-0.06

stock-summary
Return on Equity

-2.31%

stock-summary
Price to Book

2.76

Revenue and Profits:
Net Sales:
200 Cr
(Quarterly Results - Jun 2026)
Net Profit:
2 Cr
stock-summaryTotal Returns
Total Returns (Price + Dividend) stock-summary
Dividend Yield (0%)
TimePeriod
Price Return
Dividend Return
Total Return
3 Months
-26.88%
0%
-26.88%
6 Months
16.96%
0%
16.96%
1 Year
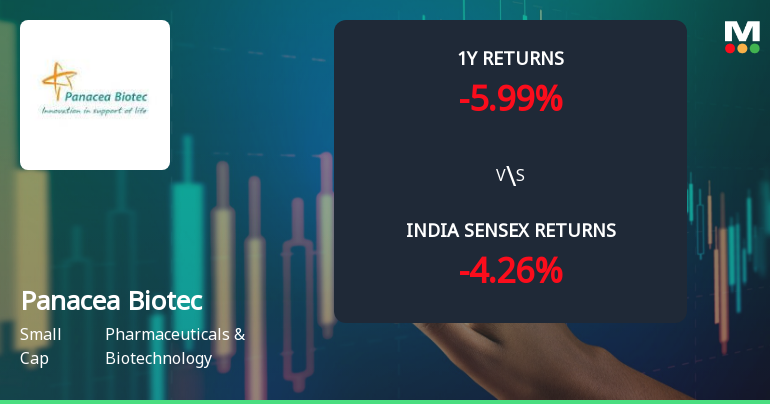
-6.05%
0%
-6.05%
2 Years
22.31%
0%
22.31%
3 Years
144.01%
0%
144.01%
4 Years
170.4%
0%
170.4%
5 Years
31.58%
0%
31.58%

Latest dividend: 0.6340858623242043 per share ex-dividend date: Sep-19-2011

Risk Adjusted Returns v/s stock-summary
Returns Beta
Icon
Beta has not been calculated since enough price history is not available
stock-summaryNews & Corporate Actions

Announcements stock-summary

Communication Sent To Physical Shareholders To Furnish PAN And KYC Details

15-Sep-2026 | Source : BSE

Please note that reminder letters dated 15.09.2026 is being sent to the shareholders holding shares in physical mode requesting them to furnish PAN and KYC details for updation to the Company / RTA along with request to dematerialize the shares with Depository Participant. A copy of the reminder letter is enclosed herewith.

Announcement under Regulation 30 (LODR)-Newspaper Publication

08-Sep-2026 | Source : BSE

Please find enclosed copies of newspaper advertisement regarding Notice of 42nd AGM Cut-off date and Remote e-Voting information published on September 08 2026.

Reg. 34 (1) Annual Report.

07-Sep-2026 | Source : BSE

Please find attached Annual Report for FY 2025-26

Corporate Actions stock-summary

stock-summary
BOARD MEETING

No Upcoming Board Meetings

stock-summary
DIVIDEND

Panacea Biotec Ltd has declared 75% dividend, ex-date: 19 Sep 11

stock-summary
SPLITS

No Splits history available

stock-summary
BONUS

No Bonus history available

stock-summary
RIGHTS

No Rights history available

stock-summaryKey Factors

Quality key factors stock-summary

Factor
Value
Sales Growth (5y)
1.50%
EBIT Growth (5y)
-233.29%
EBIT to Interest (avg)
-10.27
Debt to EBITDA (avg)
2.73
Net Debt to Equity (avg)
-0.06
Sales to Capital Employed (avg)
0.72
Tax Ratio
13.90%
Dividend Payout Ratio
0
Pledged Shares
0
Institutional Holding
4.56%
ROCE (avg)
-12.06%
ROE (avg)
0

Valuation key factors

Factor
Value
P/E Ratio
NA (Loss Making)
Industry P/E
38
Price to Book Value
2.81
EV to EBIT
-75.51
EV to EBITDA
1047.46
EV to Capital Employed
2.93
EV to Sales
3.41
PEG Ratio
NA
Dividend Yield
NA
ROCE (Latest)
-4.81%
ROE (Latest)
-2.31%

Technicals key factors

Indicator
Weekly
Monthly
MACD
Bearish
Mildly Bearish
RSI
No Signal
No Signal
Bollinger Bands
Mildly Bearish
Bearish
Moving Averages
Mildly Bullish (Daily)
KST
Bearish
Mildly Bearish
Dow Theory
No Trend
Mildly Bearish
OBV
No Trend
Mildly Bearish
stock-summary Technical Indicator Scale: Bearish, Mildly Bearish, Sideways, Mildly Bullish, Bullish  Turned 
stock-summaryShareholding
Shareholding Snapshot : Jun 2026stock-summary
Shareholding Compare (%holding) stock-summary
Majority shareholders

Promoters

Pledged Promoter Holdings

None

Mutual Funds

Held by 2 Schemes (0.0%)

FIIs

Held by 16 FIIs (2.31%)

Promoter with highest holding

Dr. Rajesh Jain (49.01%)

Highest Public shareholder

Massachusetts Institute Of Technology (1.71%)

Individual Investors Holdings

15.54%

stock-summaryFinancial
[
  {
    "link": "quarterly",
    "btn_text": "All Quarterly Results",
    "header": "Quarterly Results Snapshot (Consolidated) - Jun'26 - YoY",
    "rhs": [
      {
        "prefix": "Net Sales ",
        "suffix": "YoY Growth in quarter ended Jun 2026 is 19.72% vs 44.05% in Jun 2025",
        "dir": -1
      },
      {
        "prefix": "Consolidated Net Profit ",
        "suffix": "YoY Growth in quarter ended Jun 2026 is -43.21% vs 125.63% in Jun 2025",
        "dir": -1
      }
    ],
    "table": {
      "header": [
        "Jun'26",
        "Jun'25",
        "Change(%)"
      ],
      "body": [
        {
          "field": "Net Sales",
          "val1": "199.57",
          "val2": "166.70",
          "chgp": "19.72%",
          "chgp_class": "positive"
        },
        {
          "field": "Operating Profit (PBDIT) excl Other Income",
          "val1": "5.67",
          "val2": "-1.18",
          "chgp": "580.51%",
          "chgp_class": "positive"
        },
        {
          "field": "Interest",
          "val1": "1.18",
          "val2": "0.86",
          "chgp": "37.21%",
          "chgp_class": "negative"
        },
        {
          "field": "Exceptional Items",
          "val1": "2.74",
          "val2": "11.32",
          "chgp": "-75.80%",
          "chgp_class": "negative"
        },
        {
          "field": "Consolidate Net Profit",
          "val1": "2.30",
          "val2": "4.05",
          "chgp": "-43.21%",
          "chgp_class": "negative"
        },
        {
          "field": "Operating Profit Margin (Excl OI)",
          "val1": "2.84%",
          "val2": "-0.71%",
          "chgp": "3.55%",
          "chgp_class": "positive"
        }
      ]
    }
  },
  {
    "link": "half-yearly",
    "btn_text": "All Half Yearly Results",
    "header": "Half Yearly Results Snapshot (Consolidated) - Sep'25",
    "rhs": [
      {
        "prefix": "Net Sales ",
        "suffix": " Growth in half year ended Sep 2025 is 17.01% vs -3.36% in Sep 2024",
        "dir": 1
      },
      {
        "prefix": "Consolidated Net Profit ",
        "suffix": " Growth in half year ended Sep 2025 is 11.64% vs -515.24% in Sep 2024",
        "dir": 1
      }
    ],
    "table": {
      "header": [
        "Sep'25",
        "Sep'24",
        "Change(%)"
      ],
      "body": [
        {
          "field": "Net Sales",
          "val1": "307.83",
          "val2": "263.07",
          "chgp": "17.01%",
          "chgp_class": "positive"
        },
        {
          "field": "Operating Profit (PBDIT) excl Other Income",
          "val1": "-18.97",
          "val2": "-6.99",
          "chgp": "-171.39%",
          "chgp_class": "negative"
        },
        {
          "field": "Interest",
          "val1": "3.00",
          "val2": "1.85",
          "chgp": "62.16%",
          "chgp_class": "negative"
        },
        {
          "field": "Exceptional Items",
          "val1": "14.02",
          "val2": "5.51",
          "chgp": "154.45%",
          "chgp_class": "positive"
        },
        {
          "field": "Consolidate Net Profit",
          "val1": "-9.87",
          "val2": "-11.17",
          "chgp": "11.64%",
          "chgp_class": "positive"
        },
        {
          "field": "Operating Profit Margin (Excl OI)",
          "val1": "-6.16%",
          "val2": "-2.66%",
          "chgp": "-3.50%",
          "chgp_class": "negative"
        }
      ]
    }
  },
  {
    "link": "nine-monthly",
    "btn_text": "All Nine Monthly Results",
    "header": "Nine Monthly Results Snapshot (Consolidated) - Dec'25",
    "rhs": [
      {
        "prefix": "Net Sales ",
        "suffix": "YoY Growth in nine months ended Dec 2025 is 10.89% vs 0.91% in Dec 2024",
        "dir": 1
      },
      {
        "prefix": "Consolidated Net Profit ",
        "suffix": "YoY Growth in nine months ended Dec 2025 is 11.43% vs -1,721.95% in Dec 2024",
        "dir": 1
      }
    ],
    "table": {
      "header": [
        "Dec'25",
        "Dec'24",
        "Change(%)"
      ],
      "body": [
        {
          "field": "Net Sales",
          "val1": "473.02",
          "val2": "426.56",
          "chgp": "10.89%",
          "chgp_class": "positive"
        },
        {
          "field": "Operating Profit (PBDIT) excl Other Income",
          "val1": "-7.23",
          "val2": "0.97",
          "chgp": "-845.36%",
          "chgp_class": "negative"
        },
        {
          "field": "Interest",
          "val1": "4.85",
          "val2": "2.84",
          "chgp": "70.77%",
          "chgp_class": "negative"
        },
        {
          "field": "Exceptional Items",
          "val1": "16.79",
          "val2": "8.28",
          "chgp": "102.78%",
          "chgp_class": "positive"
        },
        {
          "field": "Consolidate Net Profit",
          "val1": "-5.89",
          "val2": "-6.65",
          "chgp": "11.43%",
          "chgp_class": "positive"
        },
        {
          "field": "Operating Profit Margin (Excl OI)",
          "val1": "-1.53%",
          "val2": "0.23%",
          "chgp": "-1.76%",
          "chgp_class": "negative"
        }
      ]
    }
  },
  {
    "link": "annual",
    "btn_text": "All Annual Results",
    "header": "Annual Results Snapshot (Consolidated) - Mar'26",
    "rhs": [
      {
        "prefix": "Net Sales ",
        "suffix": "YoY Growth in year ended Mar 2026 is 14.43% vs -0.01% in Mar 2025",
        "dir": 1
      },
      {
        "prefix": "Consolidated Net Profit ",
        "suffix": "YoY Growth in year ended Mar 2026 is 35.84% vs -615.38% in Mar 2025",
        "dir": 1
      }
    ],
    "table": {
      "header": [
        "Mar'26",
        "Mar'25",
        "Change(%)"
      ],
      "body": [
        {
          "field": "Net Sales",
          "val1": "639.77",
          "val2": "559.09",
          "chgp": "14.43%",
          "chgp_class": "positive"
        },
        {
          "field": "Operating Profit (PBDIT) excl Other Income",
          "val1": "-4.66",
          "val2": "-25.91",
          "chgp": "82.01%",
          "chgp_class": "positive"
        },
        {
          "field": "Interest",
          "val1": "6.05",
          "val2": "3.88",
          "chgp": "55.93%",
          "chgp_class": "negative"
        },
        {
          "field": "Exceptional Items",
          "val1": "19.50",
          "val2": "35.99",
          "chgp": "-45.82%",
          "chgp_class": "negative"
        },
        {
          "field": "Consolidate Net Profit",
          "val1": "-5.37",
          "val2": "-8.37",
          "chgp": "35.84%",
          "chgp_class": "positive"
        },
        {
          "field": "Operating Profit Margin (Excl OI)",
          "val1": "-0.73%",
          "val2": "-4.63%",
          "chgp": "3.90%",
          "chgp_class": "positive"
        }
      ]
    }
  }
]

Quarterly Results Snapshot (Consolidated) - Jun'26 - YoYstock-summary

Jun'26
Jun'25
Change(%)
Net Sales
199.57
166.70
19.72%
Operating Profit (PBDIT) excl Other Income
5.67
-1.18
580.51%
Interest
1.18
0.86
37.21%
Exceptional Items
2.74
11.32
-75.80%
Consolidate Net Profit
2.30
4.05
-43.21%
Operating Profit Margin (Excl OI)
2.84%
-0.71%
3.55%
Values in Rs Cr.
Direction Arrows
Net Sales

YoY Growth in quarter ended Jun 2026 is 19.72% vs 44.05% in Jun 2025

Direction Arrows
Consolidated Net Profit

YoY Growth in quarter ended Jun 2026 is -43.21% vs 125.63% in Jun 2025

Half Yearly Results Snapshot (Consolidated) - Sep'25stock-summary

Sep'25
Sep'24
Change(%)
Net Sales
307.83
263.07
17.01%
Operating Profit (PBDIT) excl Other Income
-18.97
-6.99
-171.39%
Interest
3.00
1.85
62.16%
Exceptional Items
14.02
5.51
154.45%
Consolidate Net Profit
-9.87
-11.17
11.64%
Operating Profit Margin (Excl OI)
-6.16%
-2.66%
-3.50%
Values in Rs Cr.
Direction Arrows
Net Sales

Growth in half year ended Sep 2025 is 17.01% vs -3.36% in Sep 2024

Direction Arrows
Consolidated Net Profit

Growth in half year ended Sep 2025 is 11.64% vs -515.24% in Sep 2024

Nine Monthly Results Snapshot (Consolidated) - Dec'25stock-summary

Dec'25
Dec'24
Change(%)
Net Sales
473.02
426.56
10.89%
Operating Profit (PBDIT) excl Other Income
-7.23
0.97
-845.36%
Interest
4.85
2.84
70.77%
Exceptional Items
16.79
8.28
102.78%
Consolidate Net Profit
-5.89
-6.65
11.43%
Operating Profit Margin (Excl OI)
-1.53%
0.23%
-1.76%
Values in Rs Cr.
Direction Arrows
Net Sales

YoY Growth in nine months ended Dec 2025 is 10.89% vs 0.91% in Dec 2024

Direction Arrows
Consolidated Net Profit

YoY Growth in nine months ended Dec 2025 is 11.43% vs -1,721.95% in Dec 2024

Annual Results Snapshot (Consolidated) - Mar'26stock-summary

Mar'26
Mar'25
Change(%)
Net Sales
639.77
559.09
14.43%
Operating Profit (PBDIT) excl Other Income
-4.66
-25.91
82.01%
Interest
6.05
3.88
55.93%
Exceptional Items
19.50
35.99
-45.82%
Consolidate Net Profit
-5.37
-8.37
35.84%
Operating Profit Margin (Excl OI)
-0.73%
-4.63%
3.90%
Values in Rs Cr.
Direction Arrows
Net Sales

YoY Growth in year ended Mar 2026 is 14.43% vs -0.01% in Mar 2025

Direction Arrows
Consolidated Net Profit

YoY Growth in year ended Mar 2026 is 35.84% vs -615.38% in Mar 2025

stock-summaryCompany CV
About Panacea Biotec Ltd stock-summary
stock-summary
Panacea Biotec Ltd
Small Cap
Pharmaceuticals & Biotechnology
India's leading research-based health management company with established research, manufacturing and marketing capabilities are collectively known as Panacea Biotec Limited (PBL), which was incorporated on February 2, 1984 under the name of Panacea Drug (P) Ltd.
Company Coordinates stock-summary
Company Details
Ambala-Chandigarh Highway , Lalru Punjab : 140501
stock-summary
Tel: 91-1762-505900
stock-summary
companysec@panaceabiotec.com
Registrar Details
Skyline Financial Services Pvt Ltd , D-153/A, 1st Floor, Okhla Industrial Area, Phase - I, New Delhi