Poonawalla Fin

  • Market Cap: Mid Cap
  • Industry: Non Banking Financial Company (NBFC)
  • ISIN: INE511C01022
  • NSEID: POONAWALLA
  • BSEID: 524000
INR
473.30
10.7 (2.31%)
BSENSE

Jul 22, 03:30 PM

BSE+NSE Vol: 14.89 lacs

  • Price Points
  • Score
  • Mojo Parameters
  • Total Return
  • News and Corporate Actions
  • Key factors
  • Shareholding
  • Financials
  • CompanyCV
stock-summaryPrice Point
High/Low

1Day

52 Week

Valuation
Technical
Day's Volume

CASH

14.89 lacs (-29.43%) Volume

Shareholding (Jun 2026)

FII

10.96%

Held by 162 FIIs

DII

16.74%

Held by 41 DIIs

Promoter

59.02%

Why is Poonawalla Fincorp Ltd falling/rising?

22-Jul-2026

As of 22-Jul, Poonawalla Fincorp Ltd's stock price is rising to Rs 473.30, driven by strong performance metrics, a trend reversal after declines, and positive quarterly results, despite being considered expensive compared to peers. High institutional holdings further support investor confidence in the stock.

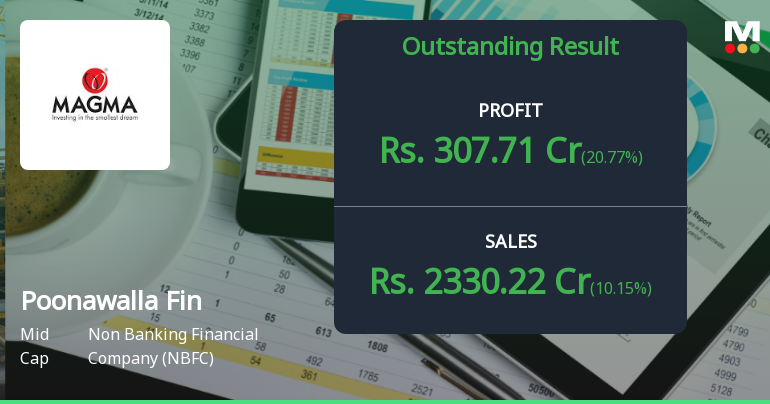
As of 22-Jul, Poonawalla Fincorp Ltd's stock price is rising, currently at Rs 473.30, reflecting a change of Rs 10.7 or 2.31%. This upward movement can be attributed to several factors. Firstly, the stock has outperformed its sector by 2.99% today, indicating strong relative performance. Additionally, it has experienced a trend reversal, gaining after two consecutive days of decline, which may signal renewed investor interest.<BR><BR>The stock reached an intraday high of Rs 473.9, showing positive momentum. Furthermore, Poonawalla Fincorp is trading above its 5-day, 20-day, 50-day, 100-day, and 200-day moving averages, suggesting a bullish trend. Despite a decrease in investor participation, with delivery volume falling by 50.64% against the 5-day average, the stock remains liquid enough for trading.<BR><BR>On the fundamental side, the company has demonstrated strong long-term growth, with operating profits increasing at a compound annual growth rate (CAGR) of 71.48%. The recent quarterly results have been outstanding, with net sales reaching Rs 2,330.22 crore and a net profit growth of 20.77%. The positive performance over the last four quarters has likely bolstered investor confidence.<BR><BR>However, it is important to note that the stock is considered expensive, trading at a premium compared to its peers, with a price-to-book value of 4. Despite this, the high institutional holdings at 27.7% indicate confidence from more sophisticated investors, which can further support the stock's price. Overall, the combination of strong performance metrics, positive quarterly results, and institutional backing contributes to the rising stock price of Poonawalla Fincorp Ltd.

View full answer

Are Poonawalla Fincorp Ltd latest results good or bad?

18-Jul-2026

Poonawalla Fincorp Ltd's latest Q1 FY27 results are strong, with a net profit increase of 391.55% year-on-year and net sales growth of 77.34%. However, investors should be cautious due to a high P/E ratio of 77.70 and a significant debt-to-equity ratio of 4.68.

Poonawalla Fincorp Ltd's latest results for Q1 FY27 are quite impressive and indicate a strong turnaround for the company. The net profit reached ₹307.71 crores, marking a remarkable 391.55% increase year-on-year. Additionally, net sales surged to ₹2,330.22 crores, reflecting a 77.34% year-on-year growth. The operating margin also improved significantly to 58.22%, up 8.64 percentage points from the previous year.<BR><BR>This performance is particularly noteworthy as it follows a challenging period in FY25 when the company reported a loss. The current results highlight a successful recovery, with both net profit and sales showing strong sequential growth as well. <BR><BR>However, while the growth metrics are outstanding, it's important to note that the company's valuation is considered very high, with a P/E ratio of 77.70 times, which raises concerns about sustainability. The high debt-to-equity ratio of 4.68 also indicates significant leverage, which could amplify financial risks.<BR><BR>In summary, the latest results are good in terms of growth and profitability, but investors should remain cautious due to the high valuation and leverage concerns.

View full answer

Should I buy, sell or hold Poonawalla Fincorp Ltd?

18-Jul-2026

How big is Poonawalla Fin?

11-Jun-2026

As of 10th June, Poonawalla Fincorp Ltd has a market capitalization of 33,734.00 Cr, with recent net sales of 6,790.18 Cr and a net profit of 541.81 Cr.

As of 10th June, Poonawalla Fincorp Ltd has a market capitalization of 33,734.00 Cr, categorizing it as a Mid Cap company.<BR><BR>In the latest 4 quarters, Poonawalla Fincorp reported Net Sales of 6,790.18 Cr and a Net Profit of 541.81 Cr.<BR><BR>The latest annual period for the balance sheet is March 2025, with Shareholder's Funds amounting to 8,174.66 Cr and Total Assets of 34,824.46 Cr.

View full answer

Who are in the management team of Poonawalla Fin?

11-Jun-2026

The management team of Poonawalla Fin includes Abhay Bhutada (Managing Director), ADAR CYRUS POONAWALLA (Chairman), and several Non-Executive and Independent Directors, bringing diverse expertise to the company.

The management team of Poonawalla Fin includes the following individuals:<BR><BR>1. **Abhay Bhutada** - Managing Director<BR>2. **Shabnum Zaman** - Company Secretary & Compliance Officer<BR>3. **ADAR CYRUS POONAWALLA** - Chairman (Non-Executive)<BR>4. **Amar Deshpande** - Non-Executive Director<BR>5. **Vijayalakshmi R Iyer** - Non-Executive & Independent Director<BR>6. **B Prasada Rao** - Non-Executive & Independent Director<BR>7. **Prabhakar Dalal** - Non-Executive & Independent Director<BR>8. **Sanjay Kumar** - Non-Executive & Independent Director<BR>9. **Gorinka Jaganmohan Rao** - Non-Executive & Independent Director<BR>10. **Atul Kumar Gupta** - Non-Executive Director<BR>11. **Sajit M Fazalbhoy** - Non-Executive Director<BR><BR>This team brings a diverse range of experience and expertise to the company.

View full answer

Who are the peers of the Poonawalla Fin?

11-Jun-2026

Poonawalla Fin's peers include SBI Cards, HDB FINANC SER, Sundaram Finance, Authum Invest., M & M Fin. Serv., Tata Inv.Corpn., Manappuram Fin., Chola Financial, and IIFL Finance. In terms of management risk and growth, Poonawalla Fin shows good performance, while its 1-year return of -11.31% is better than SBI Cards but worse than Manappuram Fin's 6.91%.

Peers: The peers of Poonawalla Fin are SBI Cards, HDB FINANC SER, Sundaram Finance, Authum Invest., M & M Fin. Serv., Tata Inv.Corpn., Manappuram Fin., Chola Financial, and IIFL Finance.<BR><BR>Quality Snapshot: Excellent management risk is observed at SBI Cards, while Good management risk is found at HDB FINANC SER, Sundaram Finance, Manappuram Fin., and IIFL Finance. Average management risk is noted at Authum Invest., M & M Fin. Serv., Chola Financial, and Capri Global, and the rest. Below Average management risk is present at Tata Inv.Corpn. Growth is Excellent at Chola Financial and Capri Global, Good at Poonawalla Fin, while Average growth is seen at SBI Cards, Sundaram Finance, M & M Fin. Serv., and Tata Inv.Corpn., and the rest. Below Average growth is found at HDB FINANC SER, Authum Invest., and Manappuram Fin.<BR><BR>Return Snapshot: The peer with the highest 1-year return is Manappuram Fin. at 6.91%, while the lowest is SBI Cards at -41.86%. Poonawalla Fin's 1-year return of -11.31% is better than SBI Cards but worse than Manappuram Fin. Additionally, several peers, including SBI Cards, Sundaram Finance, M & M Fin. Serv., Tata Inv.Corpn., Chola Financial, and IIFL Finance, have negative six-month returns.

View full answer

What does Poonawalla Fin do?

10-Jun-2026

Poonawalla Fincorp Ltd is a mid-cap Non-Banking Financial Company (NBFC) that provides various financial services. As of March 2026, it reported net sales of ₹2,115 Cr and a net profit of ₹255 Cr, with a market cap of ₹33,734 Cr.

Overview:<BR>Poonawalla Fincorp Ltd operates as a Non Banking Financial Company (NBFC) in the mid-cap market segment.<BR><BR>History:<BR>The company was incorporated in 1978 as 'Magma Fincorp Limited' and underwent several name changes, becoming Poonawalla Fincorp Limited on July 12, 2021. The most recent quarterly results reported net sales and net profit for the period ending March 2026.<BR><BR>Financial Snapshot:<BR>- Net Sales: 2,115 Cr (Quarterly Results - Mar 2026)<BR>- Net Profit: 255 Cr (Quarterly Results - Mar 2026)<BR>- Market Cap: INR 33,734 Cr (Mid Cap)<BR><BR>Key Metrics:<BR>- P/E: 62.00<BR>- Industry P/E: 20<BR>- Dividend Yield: 0.00%<BR>- Debt Equity: 4.68<BR>- Return on Equity: 5.24%<BR>- Price to Book: 3.26<BR><BR>Contact Details:<BR>- Address: Development House, 24 Park Street Kolkata West Bengal : 700016<BR>- Tel: 91-33-44017350<BR>- Email: secretarial@poonawallafincorp.com<BR>- Website: http://www.poonawallafincorp.com

View full answer

How has been the historical performance of Poonawalla Fin?

17-Nov-2025

Poonawalla Fin's historical performance from 2019 to 2025 shows rising net sales and total assets, but significant losses, with a profit after tax of -98.34 crore in March 2025, and total liabilities increasing to 34,824.46 crore. Operating profit also declined sharply, indicating ongoing financial challenges despite growth in sales.

Answer:<BR>The historical performance of Poonawalla Fin shows significant fluctuations in key financial metrics over the years, particularly from 2019 to 2025.<BR><BR>Breakdown:<BR>Poonawalla Fin's net sales have shown a steady increase, rising from 2,454.53 crore in March 2019 to 4,189.76 crore in March 2025, with a notable jump from 3,109.01 crore in March 2024. However, the total operating income followed a similar trend, reaching 4,189.76 crore in March 2025. The total expenditure, excluding depreciation, also increased significantly to 2,778.05 crore in March 2025 from 820.07 crore in March 2024. Operating profit (PBDIT) decreased to 1,444.79 crore in March 2025 from 2,327.26 crore in March 2024, leading to a profit before tax of -135.40 crore in March 2025, down from 2,134.17 crore in March 2024. Consequently, the profit after tax turned negative at -98.34 crore in March 2025, contrasting sharply with the 1,651.51 crore reported in March 2024. The company's total liabilities surged to 34,824.46 crore in March 2025, up from 23,923.48 crore in March 2024, while total assets also increased to 34,824.46 crore in March 2025. Cash flow from operating activities remained negative at -10,569.00 crore in March 2025, indicating ongoing cash challenges despite a net cash inflow from financing activities of 10,820.00 crore. Overall, Poonawalla Fin's financial performance reflects a complex landscape of growth in sales and assets, juxtaposed with significant losses and increasing liabilities.

View full answer

Is Poonawalla Fin technically bullish or bearish?

14-Nov-2025

As of November 13, 2025, the trend is mildly bullish due to daily moving averages and monthly indicators, but caution is advised due to bearish signals from the weekly MACD and Dow Theory.

As of 13 November 2025, the technical trend has changed from bullish to mildly bullish. The current stance is mildly bullish, driven by the daily moving averages indicating mild bullishness and the monthly KST and Bollinger Bands also showing bullish signals. However, the weekly MACD and Dow Theory are mildly bearish, which tempers the overall bullish outlook. The RSI shows no signal on both weekly and monthly time frames, indicating a lack of momentum. Overall, while there are some bullish indicators, the presence of bearish signals in the weekly analysis suggests caution.

View full answer

Who are the top shareholders of the Poonawalla Fin?

17-Jul-2025

The top shareholders of Poonawalla Fin include Rising Sun Holdings Pvt Ltd with 62.53%, followed by foreign institutional investors at 9.98%, mutual fund schemes at 4.29%, and the Life Insurance Corporation of India at 2.93%. Individual investors hold 12.11% of the shares.

The top shareholders of Poonawalla Fin include the promoters, with Rising Sun Holdings Pvt Ltd holding the largest stake at 62.53%. There are also 14 mutual fund schemes that collectively hold 4.29% of the company, while foreign institutional investors (FIIs) own 9.98% through 156 different entities. The highest public shareholder is the Life Insurance Corporation of India, which holds 2.93%. Additionally, individual investors account for 12.11% of the shareholding.

View full answer

Is Poonawalla Fin overvalued or undervalued?

09-Jun-2025

As of October 28, 2024, Poonawalla Fin is considered overvalued with a valuation grade of very expensive, reflected by a PE ratio of -333.29, an EV to EBITDA of 41.67, and a negative ROE of -1.20%, despite a strong YTD return of 37.56%.

As of 28 October 2024, Poonawalla Fin's valuation grade has moved from attractive to very expensive, indicating a significant shift in its market perception. The company is currently assessed as overvalued. Key ratios reflect this status, with a PE ratio of -333.29, an EV to EBITDA of 41.67, and a Price to Book Value of 4.01, all suggesting that the stock is priced excessively compared to its earnings and book value.<BR><BR>In comparison to peers, Poonawalla Fin's valuation stands out unfavorably; for instance, Life Insurance has a PE of 12.54 and an EV to EBITDA of 9.89, while Bajaj Finance is also categorized as very expensive with a PE of 35.01. Notably, Poonawalla Fin's negative ROE of -1.20% further underscores its overvaluation. Despite recent stock performance showing a 37.56% YTD return compared to the Sensex's 5.61%, the underlying financial metrics suggest that the stock price does not align with its fundamental value.

View full answer

When is the next results date for Poonawalla Fin?

06-Jun-2025

No Upcoming Board Meetings

Has Poonawalla Fin declared dividend?

06-Jun-2025

Yes, Poonawalla Fincorp Ltd has declared a 100% dividend, amounting to ₹2 per share, with an ex-date of January 31, 2024. Despite this, the dividend yield is 0%, but the company has shown strong total returns, especially over the past 5 years.

Poonawalla Fincorp Ltd has declared a 100% dividend.<BR><BR>Dividend Details:<BR>- Percentage announced: 100%<BR>- Amount per share: 2<BR>- Ex-date: 31 Jan 24<BR><BR>Dividend Yield: 0%<BR><BR>Total Returns by Period:<BR>In the last 6 months, the price return was 18.44%, with no dividend return, resulting in a total return of 18.44%.<BR><BR>Over the past year, the price return was -7.11%, with no dividend return, leading to a total return of -7.11%.<BR><BR>In the 2-year period, the price return was 20.67%, with a dividend return of 1.17%, resulting in a total return of 21.84%.<BR><BR>For the 3-year period, the price return was 61.97%, with a dividend return of 1.95%, culminating in a total return of 63.92%.<BR><BR>In the last 4 years, the price return was 153.16%, with a dividend return of 2.94%, leading to a total return of 156.1%.<BR><BR>Over the past 5 years, the price return was an impressive 2768.58%, with a dividend return of 17.81%, resulting in a total return of 2786.39%.<BR><BR>Overall, Poonawalla Fincorp Ltd has declared a significant dividend, but the dividend yield remains at 0%. The total returns show a strong performance over the long term, particularly in the 5-year period, indicating substantial growth despite the lack of dividends in the shorter terms.

View full answer
iScoreScore
Part of MojoOne Strategy
Click here to find our call on this stock
Strong Sell
Sell
Hold
Buy
Strong Buy

Dashboard

1

Strong Long Term Fundamental Strength with a 71.48% CAGR growth in Operating Profits

 
2

Healthy long term growth as Operating profit has grown by an annual rate of 71.48%

 
3

With a growth in Net Profit of 20.77%, the company declared Outstanding results in Jun 26

4

High Institutional Holdings at 27.7%

stock-summaryMojo Parameters

Mojo Parameters

Loading Valuation Snapshot...

Stock DNA

stock-summary
Industry

Non Banking Financial Company (NBFC)

stock-summary
Market cap

INR 40,517 Cr (Mid Cap)

stock-summary
P/E

53.00

stock-summary
Industry P/E

22

stock-summary
Dividend Yield

0.00%

stock-summary
Debt Equity

4.68

stock-summary
Return on Equity

5.24%

stock-summary
Price to Book

3.94

Revenue and Profits:
Net Sales:
2,330 Cr
(Quarterly Results - Jun 2026)
Net Profit:
308 Cr
stock-summaryTotal Returns
Total Returns (Price + Dividend) stock-summary
Dividend Yield (0%)
TimePeriod
Price Return
Dividend Return
Total Return
3 Months
11.48%
0%
11.48%
6 Months
5.59%
0%
5.59%
1 Year
4.7%
0%
4.7%
2 Years
17.3%
0%
17.3%
3 Years
26.21%
0.45%
26.66%
4 Years
75.43%
1.38%
76.81%
5 Years
228.0%
2.26%
230.26%

Latest dividend: 1.9927083333333333 per share ex-dividend date: Jan-31-2024

Risk Adjusted Returns v/s stock-summary
Returns Beta
Icon
Beta has not been calculated since enough price history is not available
stock-summaryNews & Corporate Actions

News

Announcements stock-summary

Announcement under Regulation 30 (LODR)-Newspaper Publication

18-Jul-2026 | Source : BSE

Intimation w.r.t Newspaper Publication

Announcement under Regulation 30 (LODR)-Monitoring Agency Report

17-Jul-2026 | Source : BSE

Monitoring Agency Report

Board Meeting Outcome for Outcome Of Board Meeting Held On July 17 2026

17-Jul-2026 | Source : BSE

Outcome of Board Meeting held on July 17 2026

Corporate Actions stock-summary

stock-summary
BOARD MEETING

No Upcoming Board Meetings

stock-summary
DIVIDEND

Poonawalla Fincorp Ltd has declared 100% dividend, ex-date: 31 Jan 24

stock-summary
SPLITS

Poonawalla Fincorp Ltd has announced 2:10 stock split, ex-date: 13 Aug 10

stock-summary
BONUS

No Bonus history available

stock-summary
RIGHTS

No Rights history available

stock-summaryKey Factors

Quality key factors stock-summary

Factor
Value
Sales Growth (5y)
28.45%
EBIT Growth (5y)
71.48%
Net Debt to Equity (avg)
4.68
Institutional Holding
27.70%
ROE (avg)
6.48%

Valuation key factors

Factor
Value
P/E Ratio
53
Industry P/E
22
Price to Book Value
4.02
EV to EBIT
21.46
EV to EBITDA
20.95
EV to Capital Employed
1.53
EV to Sales
11.49
PEG Ratio
0.17
Dividend Yield
NA
ROCE (Latest)
5.96%
ROE (Latest)
5.24%

Technicals key factors

Indicator
Weekly
Monthly
MACD
Bullish
Mildly Bearish
RSI
No Signal
No Signal
Bollinger Bands
Mildly Bullish
Bullish
Moving Averages
Mildly Bearish (Daily)
KST
Bullish
Mildly Bearish
Dow Theory
Mildly Bullish
Mildly Bullish
OBV
Mildly Bullish
Bullish
stock-summary Technical Indicator Scale: Bearish, Mildly Bearish, Sideways, Mildly Bullish, Bullish  Turned 
stock-summaryShareholding
Shareholding Snapshot : Jun 2026stock-summary
Shareholding Compare (%holding) stock-summary
Majority shareholders

Promoters

Pledged Promoter Holdings

None

Mutual Funds

Held by 20 Schemes (11.22%)

FIIs

Held by 162 FIIs (10.96%)

Promoter with highest holding

Rising Sun Holdings Pvt Ltd (59.02%)

Highest Public shareholder

Kotak Midcap Fund (6.75%)

Individual Investors Holdings

9.11%

stock-summaryFinancial
[
  {
    "link": "quarterly",
    "btn_text": "All Quarterly Results",
    "header": "Quarterly Results Snapshot (Consolidated) - Jun'26 - QoQ",
    "rhs": [
      {
        "prefix": "Net Sales ",
        "suffix": "QoQ Growth in quarter ended Jun 2026 is 10.15% vs 16.34% in Mar 2026",
        "dir": -1
      },
      {
        "prefix": "Consolidated Net Profit ",
        "suffix": "QoQ Growth in quarter ended Jun 2026 is 20.77% vs 69.61% in Mar 2026",
        "dir": -1
      }
    ],
    "table": {
      "header": [
        "Jun'26",
        "Mar'26",
        "Change(%)"
      ],
      "body": [
        {
          "field": "Net Sales",
          "val1": "2,330.22",
          "val2": "2,115.49",
          "chgp": "10.15%",
          "chgp_class": "positive"
        },
        {
          "field": "Operating Profit (PBDIT) excl Other Income",
          "val1": "1,356.61",
          "val2": "1,205.76",
          "chgp": "12.51%",
          "chgp_class": "positive"
        },
        {
          "field": "Interest",
          "val1": "921.65",
          "val2": "844.06",
          "chgp": "9.19%",
          "chgp_class": "negative"
        },
        {
          "field": "Exceptional Items",
          "val1": "0.00",
          "val2": "0.00",
          "chgp": "",
          "chgp_class": "neutral"
        },
        {
          "field": "Consolidate Net Profit",
          "val1": "307.71",
          "val2": "254.79",
          "chgp": "20.77%",
          "chgp_class": "positive"
        },
        {
          "field": "Operating Profit Margin (Excl OI)",
          "val1": "58.22%",
          "val2": "57.00%",
          "chgp": "1.22%",
          "chgp_class": "positive"
        }
      ]
    }
  },
  {
    "link": "half-yearly",
    "btn_text": "All Half Yearly Results",
    "header": "Half Yearly Results Snapshot (Consolidated) - Sep'25",
    "rhs": [
      {
        "prefix": "Net Sales ",
        "suffix": " Growth in half year ended Sep 2025 is 45.25% vs 37.38% in Sep 2024",
        "dir": 1
      },
      {
        "prefix": "Consolidated Net Profit ",
        "suffix": " Growth in half year ended Sep 2025 is 176.25% vs -116.52% in Sep 2024",
        "dir": 1
      }
    ],
    "table": {
      "header": [
        "Sep'25",
        "Sep'24",
        "Change(%)"
      ],
      "body": [
        {
          "field": "Net Sales",
          "val1": "2,856.27",
          "val2": "1,966.46",
          "chgp": "45.25%",
          "chgp_class": "positive"
        },
        {
          "field": "Operating Profit (PBDIT) excl Other Income",
          "val1": "1,410.23",
          "val2": "435.30",
          "chgp": "223.97%",
          "chgp_class": "positive"
        },
        {
          "field": "Interest",
          "val1": "1,183.90",
          "val2": "671.69",
          "chgp": "76.26%",
          "chgp_class": "negative"
        },
        {
          "field": "Exceptional Items",
          "val1": "0.00",
          "val2": "0.00",
          "chgp": "",
          "chgp_class": "neutral"
        },
        {
          "field": "Consolidate Net Profit",
          "val1": "136.80",
          "val2": "-179.40",
          "chgp": "176.25%",
          "chgp_class": "positive"
        },
        {
          "field": "Operating Profit Margin (Excl OI)",
          "val1": "49.37%",
          "val2": "22.14%",
          "chgp": "27.23%",
          "chgp_class": "positive"
        }
      ]
    }
  },
  {
    "link": "nine-monthly",
    "btn_text": "All Nine Monthly Results",
    "header": "Nine Monthly Results Snapshot (Consolidated) - Dec'25",
    "rhs": [
      {
        "prefix": "Net Sales ",
        "suffix": "YoY Growth in nine months ended Dec 2025 is 54.61% vs 37.81% in Dec 2024",
        "dir": 1
      },
      {
        "prefix": "Consolidated Net Profit ",
        "suffix": "YoY Growth in nine months ended Dec 2025 is 278.64% vs -111.89% in Dec 2024",
        "dir": 1
      }
    ],
    "table": {
      "header": [
        "Dec'25",
        "Dec'24",
        "Change(%)"
      ],
      "body": [
        {
          "field": "Net Sales",
          "val1": "4,674.69",
          "val2": "3,023.49",
          "chgp": "54.61%",
          "chgp_class": "positive"
        },
        {
          "field": "Operating Profit (PBDIT) excl Other Income",
          "val1": "2,373.19",
          "val2": "860.63",
          "chgp": "175.75%",
          "chgp_class": "positive"
        },
        {
          "field": "Interest",
          "val1": "1,922.61",
          "val2": "1,056.71",
          "chgp": "81.94%",
          "chgp_class": "negative"
        },
        {
          "field": "Exceptional Items",
          "val1": "0.00",
          "val2": "0.00",
          "chgp": "",
          "chgp_class": "neutral"
        },
        {
          "field": "Consolidate Net Profit",
          "val1": "287.02",
          "val2": "-160.67",
          "chgp": "278.64%",
          "chgp_class": "positive"
        },
        {
          "field": "Operating Profit Margin (Excl OI)",
          "val1": "50.77%",
          "val2": "28.46%",
          "chgp": "22.31%",
          "chgp_class": "positive"
        }
      ]
    }
  },
  {
    "link": "annual",
    "btn_text": "All Annual Results",
    "header": "Annual Results Snapshot (Consolidated) - Mar'26",
    "rhs": [
      {
        "prefix": "Net Sales ",
        "suffix": "YoY Growth in year ended Mar 2026 is 62.07% vs 34.76% in Mar 2025",
        "dir": 1
      },
      {
        "prefix": "Consolidated Net Profit ",
        "suffix": "YoY Growth in year ended Mar 2026 is 650.96% vs -105.84% in Mar 2025",
        "dir": 1
      }
    ],
    "table": {
      "header": [
        "Mar'26",
        "Mar'25",
        "Change(%)"
      ],
      "body": [
        {
          "field": "Net Sales",
          "val1": "6,790.18",
          "val2": "4,189.76",
          "chgp": "62.07%",
          "chgp_class": "positive"
        },
        {
          "field": "Operating Profit (PBDIT) excl Other Income",
          "val1": "3,578.95",
          "val2": "1,411.71",
          "chgp": "153.52%",
          "chgp_class": "positive"
        },
        {
          "field": "Interest",
          "val1": "2,766.67",
          "val2": "1,515.09",
          "chgp": "82.61%",
          "chgp_class": "negative"
        },
        {
          "field": "Exceptional Items",
          "val1": "0.00",
          "val2": "0.00",
          "chgp": "",
          "chgp_class": "neutral"
        },
        {
          "field": "Consolidate Net Profit",
          "val1": "541.81",
          "val2": "-98.34",
          "chgp": "650.96%",
          "chgp_class": "positive"
        },
        {
          "field": "Operating Profit Margin (Excl OI)",
          "val1": "52.71%",
          "val2": "33.69%",
          "chgp": "19.02%",
          "chgp_class": "positive"
        }
      ]
    }
  }
]

Quarterly Results Snapshot (Consolidated) - Jun'26 - QoQstock-summary

Jun'26
Mar'26
Change(%)
Net Sales
2,330.22
2,115.49
10.15%
Operating Profit (PBDIT) excl Other Income
1,356.61
1,205.76
12.51%
Interest
921.65
844.06
9.19%
Exceptional Items
0.00
0.00
Consolidate Net Profit
307.71
254.79
20.77%
Operating Profit Margin (Excl OI)
58.22%
57.00%
1.22%
Values in Rs Cr.
Direction Arrows
Net Sales

QoQ Growth in quarter ended Jun 2026 is 10.15% vs 16.34% in Mar 2026

Direction Arrows
Consolidated Net Profit

QoQ Growth in quarter ended Jun 2026 is 20.77% vs 69.61% in Mar 2026

Half Yearly Results Snapshot (Consolidated) - Sep'25stock-summary

Sep'25
Sep'24
Change(%)
Net Sales
2,856.27
1,966.46
45.25%
Operating Profit (PBDIT) excl Other Income
1,410.23
435.30
223.97%
Interest
1,183.90
671.69
76.26%
Exceptional Items
0.00
0.00
Consolidate Net Profit
136.80
-179.40
176.25%
Operating Profit Margin (Excl OI)
49.37%
22.14%
27.23%
Values in Rs Cr.
Direction Arrows
Net Sales

Growth in half year ended Sep 2025 is 45.25% vs 37.38% in Sep 2024

Direction Arrows
Consolidated Net Profit

Growth in half year ended Sep 2025 is 176.25% vs -116.52% in Sep 2024

Nine Monthly Results Snapshot (Consolidated) - Dec'25stock-summary

Dec'25
Dec'24
Change(%)
Net Sales
4,674.69
3,023.49
54.61%
Operating Profit (PBDIT) excl Other Income
2,373.19
860.63
175.75%
Interest
1,922.61
1,056.71
81.94%
Exceptional Items
0.00
0.00
Consolidate Net Profit
287.02
-160.67
278.64%
Operating Profit Margin (Excl OI)
50.77%
28.46%
22.31%
Values in Rs Cr.
Direction Arrows
Net Sales

YoY Growth in nine months ended Dec 2025 is 54.61% vs 37.81% in Dec 2024

Direction Arrows
Consolidated Net Profit

YoY Growth in nine months ended Dec 2025 is 278.64% vs -111.89% in Dec 2024

Annual Results Snapshot (Consolidated) - Mar'26stock-summary

Mar'26
Mar'25
Change(%)
Net Sales
6,790.18
4,189.76
62.07%
Operating Profit (PBDIT) excl Other Income
3,578.95
1,411.71
153.52%
Interest
2,766.67
1,515.09
82.61%
Exceptional Items
0.00
0.00
Consolidate Net Profit
541.81
-98.34
650.96%
Operating Profit Margin (Excl OI)
52.71%
33.69%
19.02%
Values in Rs Cr.
Direction Arrows
Net Sales

YoY Growth in year ended Mar 2026 is 62.07% vs 34.76% in Mar 2025

Direction Arrows
Consolidated Net Profit

YoY Growth in year ended Mar 2026 is 650.96% vs -105.84% in Mar 2025

stock-summaryCompany CV
About Poonawalla Fincorp Ltd stock-summary
stock-summary
Poonawalla Fincorp Ltd
Mid Cap
Non Banking Financial Company (NBFC)
Poonawalla Fincorp Limited was erstwhile incorporated as 'Magma Fincorp Limited' on December 18, 1978 as a Private Limited Company. On October 30, 1980, the company was converted into Public Limited Company and the name was changed to Magma Leasing Limited. On June 19, 2007, the name of the company was changed from Magma Leasing Limited to Magma Shrachi Finance Limited and subsequently to Poonawalla Fincorp Limited from Magma Shrachi Finance Limited on July 12, 2021.
Company Coordinates stock-summary
Company Details
Development House, 24 Park Street Kolkata West Bengal : 700016
stock-summary
Tel: 91-33-44017350
stock-summary
secretarial@poonawallafincorp.com
Registrar Details