Prakash Industri

  • Market Cap: Small Cap
  • Industry: Ferrous Metals
  • ISIN: INE603A01013
  • NSEID: PRAKASH
  • BSEID: 506022
INR
127.80
-8.55 (-6.27%)
BSENSE

Aug 17, 12:18 PM

BSE+NSE Vol: 5.26 lacs

  • Price Points
  • Score
  • Mojo Parameters
  • Total Return
  • News and Corporate Actions
  • Key factors
  • Shareholding
  • Financials
  • CompanyCV
stock-summaryPrice Point
High/Low

1Day

52 Week

Valuation
Technical
Day's Volume

CASH

5.26 lacs (152.93%) Volume

Shareholding (Jun 2026)

FII

3.71%

Held by 54 FIIs

DII

0.04%

Held by 2 DIIs

Promoter

44.38%

Why is Prakash Industries Ltd falling/rising?

16-Aug-2026

As of 16-Aug, Prakash Industries Ltd's stock price has risen to 136.35, reflecting an 11.03% increase, driven by strong buying interest and outperformance against its sector. However, concerns about management efficiency and declining net sales may affect its long-term performance.

As of 16-Aug, Prakash Industries Ltd is experiencing a rise in its stock price, currently at 136.35, which reflects a change of 13.55 (11.03%) upward. This increase can be attributed to several factors. Firstly, the stock has outperformed its sector by 11.07% today and has shown a consecutive gain over the last two days, with a total return of 12.04% during this period. Additionally, the stock reached an intraday high of Rs 147.35, indicating strong buying interest at certain points throughout the trading day.<BR><BR>Moreover, Prakash Industries is trading above its moving averages across various time frames, including the 5-day, 20-day, 50-day, 100-day, and 200-day averages, which typically signals a bullish trend. However, it is important to note that the stock has also exhibited high volatility today, with an intraday volatility of 9.02%, suggesting significant price fluctuations.<BR><BR>Despite these positive movements, there are underlying concerns that could affect future performance. The company has shown poor management efficiency with a low return on equity (ROE) of 8.79%, and its net sales have declined at an annual rate of -1.35% over the last five years. Furthermore, the stock has underperformed the market over the past year, generating a negative return of -14.94% compared to the broader market's positive performance.<BR><BR>In summary, while Prakash Industries Ltd is currently rising due to recent gains and positive trading indicators, the company faces challenges that could impact its long-term growth and investor confidence.

View full answer

Who are in the management team of Prakash Industri?

14-Aug-2026

The management team of Prakash Industri includes V P Agarwal (Executive Chairman), Vikram Agarwal (Managing Director), Kanha Agarwal (Joint Managing Director), and several independent directors, along with Arvind Mahla (Company Secretary) and Sanjay Jain (Whole-time Director), overseeing the company's operations and strategy.

The management team of Prakash Industri includes the following individuals:<BR><BR>1. V P Agarwal - Executive Chairman<BR>2. Vikram Agarwal - Managing Director<BR>3. Kanha Agarwal - Joint Managing Director<BR>4. Y N Chugh - Independent Director<BR>5. M R Agarwal - Independent Director<BR>6. Purnima Gupta - Independent Director<BR>7. Satish Chander Gosain - Independent Director<BR>8. Sunil Kumar - Independent Director<BR>9. Arvind Mahla - Company Secretary & Compliance Officer<BR>10. Sanjay Jain - Whole-time Director<BR><BR>This team is responsible for overseeing the company's operations and strategic direction.

View full answer

What does Prakash Industri do?

14-Aug-2026

Prakash Industries Ltd manufactures steel products and generates power, classified as a small-cap company with a market cap of INR 2,200 Cr. As of June 2026, it reported net sales of 1,032 Cr and a net profit of 71 Cr.

Overview:<BR>Prakash Industries Ltd is engaged in the manufacture and sale of steel products and the generation of power, operating within the ferrous metals industry and classified as a small-cap company.<BR><BR>History:<BR>Incorporated on July 31, 1980, originally as Prakash Pipes and Industries Limited, the company was later renamed to Prakash Industries Limited. The latest quarterly results reported net sales and net profit for June 2026.<BR><BR>Financial Snapshot:<BR>- Net Sales: 1,032 Cr (Quarterly Results - Jun 2026)<BR>- Net Profit: 71 Cr (Quarterly Results - Jun 2026)<BR>- Market Cap: INR 2,200 Cr (Small Cap)<BR><BR>Key Metrics:<BR>- P/E: 7.00<BR>- Industry P/E: 24<BR>- Dividend Yield: 1.24%<BR>- Debt-Equity: 0.09<BR>- Return on Equity: 8.72%<BR>- Price to Book: 0.60<BR><BR>Contact Details:<BR>Address: 15 Km Stone, Delhi Road Hissar Haryana : 125044<BR>Phone: 91-11-28062115/28062116<BR>Email: investorshelpline@prakash.com<BR>Website: http://www.prakash.com

View full answer

Who are the peers of the Prakash Industri?

14-Aug-2026

Prakash Industri's peers include Indian Metals, Kirl. Ferrous, Sunflag Iron, Jai Balaji Inds., Maithan Alloys, Mukand, S.A.L Steel, Neetu Yoshi, and VISA Chrome. In terms of management risk, growth, capital structure, and returns, Prakash Industri shows below average performance compared to its peers.

Peers: The peers of Prakash Industri are Indian Metals, Kirl. Ferrous, Sunflag Iron, Jai Balaji Inds., Maithan Alloys, Mukand, S.A.L Steel, Neetu Yoshi, and VISA Chrome.<BR><BR>Quality Snapshot: Excellent management risk is observed at Kirl. Ferrous and Neetu Yoshi, while Average management risk is found at Indian Metals, Sunflag Iron, Jai Balaji Inds., Maithan Alloys, and Mukand, and the rest. Below Average management risk is present at Prakash Industri, S.A.L Steel, and VISA Chrome. Growth is Excellent at Jai Balaji Inds. and Neetu Yoshi, while Below Average growth is seen at Indian Metals, Kirl. Ferrous, Sunflag Iron, Maithan Alloys, Prakash Industri, Mukand, S.A.L Steel, and VISA Chrome, and the rest. Average growth is noted at Mukand. Capital Structure is Excellent at Indian Metals, Maithan Alloys, and Prakash Industri, while Good capital structure is found at Kirl. Ferrous, Sunflag Iron, and Neetu Yoshi, and the rest. Below Average capital structure is present at Mukand, S.A.L Steel, and VISA Chrome.<BR><BR>Return Snapshot: The peer with the highest 1-year return is S.A.L Steel at 357.01%, while the lowest is Jai Balaji Inds. at -33.98%. Prakash Industri's 1-year return is -25.05%, which is higher than Jai Balaji Inds. but lower than S.A.L Steel. Additionally, the six-month return is negative for Indian Metals, Kirl. Ferrous, Jai Balaji Inds., Maithan Alloys, Mukand, and S.A.L Steel.

View full answer

How big is Prakash Industri?

14-Aug-2026

As of 14th August, Prakash Industries Ltd has a market capitalization of 2,155.00 Cr, with net sales of 3,473.58 Cr and a net profit of 313.01 Cr reported in the latest four quarters.

As of 14th August, Prakash Industries Ltd has a market capitalization of 2,155.00 Cr, categorizing it as a Small Cap company.<BR><BR>In the latest four quarters, Prakash Industries reported net sales of 3,473.58 Cr and a net profit of 313.01 Cr.<BR><BR>The latest annual period for the balance sheet is March 2018, with shareholder's funds amounting to 2,736.05 Cr and total assets of 3,732.29 Cr.

View full answer

Should I buy, sell or hold Prakash Industries Ltd?

13-Aug-2026

When is the next results date for Prakash Industries Ltd?

05-Aug-2026

The next results date for Prakash Industries Ltd is August 11, 2026.

The next results date for Prakash Industries Ltd is scheduled for August 11, 2026.

View full answer

Are Prakash Industries Ltd latest results good or bad?

23-May-2026

Prakash Industries Ltd's latest results show a 7.45% increase in net profit and a 15.19% rise in revenue, indicating strong sales recovery. However, declining profit margins and rising interest costs raise concerns about overall profitability, suggesting mixed performance compared to peers in the sector.

Prakash Industries Ltd's latest results present a mixed picture. In the fourth quarter of FY26, the company reported a net profit of ₹93.32 crore, which is a 7.45% increase from the previous quarter. Revenue also saw a robust growth of 15.19%, reaching ₹919.87 crore. This indicates a strong recovery in sales compared to the previous quarter.<BR><BR>However, there are significant concerns regarding profitability. The company's PAT margin decreased to 10.14%, down from 10.88% in the prior quarter, primarily due to a sharp increase in interest costs, which surged by 47.53% to ₹13.75 crore. This rise in interest expenses has negatively impacted the company's overall profitability, despite the revenue growth.<BR><BR>Additionally, Prakash Industries has underperformed compared to its peers in the ferrous metals sector, with its stock declining 19.34% over the past year, while the sector itself gained 27.09%. The company's return on equity (ROE) remains low at 7.59%, indicating challenges in generating adequate returns on capital.<BR><BR>In summary, while the revenue growth is a positive sign, the contraction in profit margins and rising interest costs suggest that the overall results are not as favorable as they might appear at first glance. Investors should be cautious and consider these mixed signals when evaluating the company's performance.

View full answer

Is Prakash Industri overvalued or undervalued?

18-Nov-2025

As of November 17, 2025, Prakash Industri is considered undervalued with a PE ratio of 7.86 and a Price to Book Value of 0.78, despite recent underperformance against the Sensex, indicating a significant discount compared to peers like JSW Steel and Tata Steel.

As of 17 November 2025, Prakash Industri's valuation grade has moved from very attractive to attractive, indicating a shift in market perception. The company is currently assessed as undervalued, with a PE ratio of 7.86, a Price to Book Value of 0.78, and an EV to EBITDA of 5.43. These ratios suggest that the stock is trading at a significant discount compared to its earnings and book value.<BR><BR>In comparison to its peers, Prakash Industri's PE ratio is notably lower than that of JSW Steel, which stands at 46.87, and Tata Steel at 29.08. The PEG ratio of Prakash is 0.00, indicating no growth expectations priced in, while Tata Steel's PEG is 0.23, suggesting a more favorable growth outlook. Despite recent underperformance against the Sensex, with a YTD return of -6.62% compared to the Sensex's 8.72%, the long-term performance remains strong, with a 5-year return of 233.64%. This combination of factors reinforces the view that Prakash Industri is undervalued in the current market.

View full answer

How has been the historical performance of Prakash Industri?

14-Nov-2025

For the year ending March 2018, Prakash Industri reported a total operating income of 3,006.67 crore, a profit after tax of 386.25 crore, an EPS of 24.62, and maintained an operating profit margin of 19.33% and a PAT margin of 12.85%. The company had total liabilities and assets of 3,732.29 crore, with a cash flow from operating activities of 476.28 crore.

Answer:<BR>The historical performance of Prakash Industri for the year ending March 2018 shows a total operating income of 3,006.67 crore, with a raw material cost of 1,841.16 crore, leading to a total expenditure (excluding depreciation) of 2,425.59 crore. The operating profit before depreciation and interest (PBDIT) was 581.08 crore, resulting in an operating profit of 595.89 crore after accounting for other income. The profit before tax stood at 388.34 crore, with a profit after tax of 386.25 crore, yielding a PAT margin of 12.85%. The earnings per share (EPS) was reported at 24.62, while the operating profit margin was 19.33%.<BR><BR>Breakdown:<BR>In March 2018, Prakash Industri achieved net sales of 3,006.67 crore, with no other operating income reported. The company incurred a raw material cost of 1,841.16 crore and total expenditures of 2,425.59 crore, resulting in an operating profit (PBDIT) of 595.89 crore. After accounting for interest and depreciation, the profit before tax was 388.34 crore, leading to a profit after tax of 386.25 crore. The company's earnings per share were 24.62, and it maintained a healthy operating profit margin of 19.33% and a PAT margin of 12.85%. On the balance sheet, total liabilities were reported at 3,732.29 crore, with total assets matching this figure, indicating a balanced financial position. The cash flow from operating activities was 476.28 crore, while the net cash inflow for the period was 6.86 crore, reflecting a modest increase in cash and cash equivalents to 23.50 crore by the end of the period.

View full answer

Is Prakash Industri technically bullish or bearish?

07-Nov-2025

As of November 6, 2025, the technical trend is bearish with moderate strength, driven by bearish signals from the MACD, moving averages, and Bollinger Bands, despite some mildly bullish signals from Dow Theory.

As of 6 November 2025, the technical trend has changed from mildly bearish to bearish. The current technical stance is bearish with moderate strength. Key indicators driving this stance include the weekly MACD showing bearish momentum, daily moving averages indicating a bearish trend, and the Bollinger Bands on a monthly basis also reflecting a bearish outlook. Although the Dow Theory shows mildly bullish signals on a weekly basis, the overall monthly indicators, including the KST and OBV, suggest a prevailing bearish sentiment. The stock has underperformed against the Sensex over the past month and year, further supporting the bearish outlook.

View full answer

Who are the top shareholders of the Prakash Industri?

17-Jul-2025

The top shareholders of Prakash Industri include promoter Ved Prakash Agarwal with 12.38%, significant individual investors holding 33.38%, and public shareholder Dolly Khanna with 2.07%. Additionally, 62 Foreign Institutional Investors hold 3.82%, while mutual funds account for a minimal 0.01%.

The top shareholders of Prakash Industri include Ved Prakash Agarwal, who is the promoter with the highest holding at 12.38%. Additionally, the company has significant individual investor holdings, which account for 33.38% of the shares. Dolly Khanna is noted as the highest public shareholder with a stake of 2.07%. Furthermore, there are 62 Foreign Institutional Investors (FIIs) holding 3.82% of the shares, and mutual funds are represented by 5 schemes with a very small holding of 0.01%. The majority of the shares are held by non-institutional investors.

View full answer

Has Prakash Industri declared dividend?

06-Jun-2025

Yes, Prakash Industries Ltd has declared a 12% dividend, amounting to ₹1.2 per share, with an ex-date of September 17, 2024. While recent total returns show fluctuations, the company has demonstrated significant growth over the past five years.

Prakash Industries Ltd has declared a 12% dividend.<BR><BR>Dividend Details:<BR>- Percentage announced: 12%<BR>- Amount per share: 1.2<BR>- Ex-date: 17 Sep 24<BR><BR>Dividend Yield: 0.74%.<BR><BR>Total Returns by Period:<BR>Over the past 6 months, the price return was -2.17%, with a dividend return of 0%, resulting in a total return of -2.17%.<BR><BR>In the last year, the price return was 2.17%, the dividend return was 0.70%, leading to a total return of 2.87%.<BR><BR>For the 2-year period, the price return was 171.17%, the dividend return was 1.83%, culminating in a total return of 173.0%.<BR><BR>Over 3 years, the price return stood at 182.11%, with a dividend return of 2.53%, resulting in a total return of 184.64%.<BR><BR>In the 4-year period, the price return was 107.51%, the dividend return was 1.55%, leading to a total return of 109.06%.<BR><BR>Finally, for the 5-year period, the price return was 369.52%, with a dividend return of 3.40%, resulting in a total return of 372.92%.<BR><BR>Overall, Prakash Industries Ltd has declared a dividend, and while the recent total returns show some fluctuations, the long-term returns over 5 years indicate significant growth, particularly in price returns.

View full answer
iScoreScore
Click here to find our call on this stock
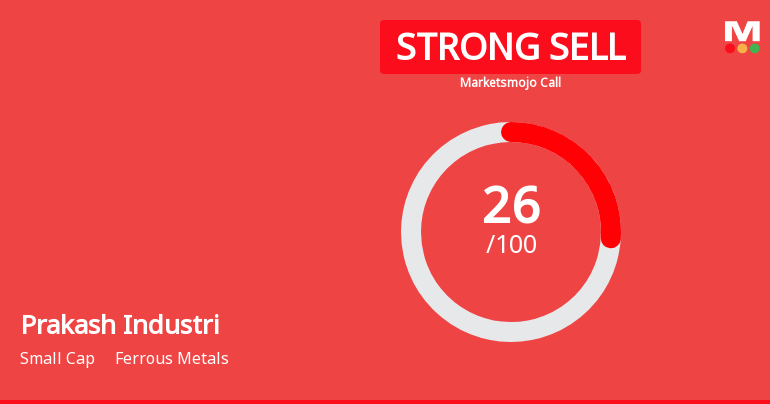
Strong Sell
Sell
Hold
Buy
Strong Buy

Dashboard

1

Poor Management Efficiency with a low ROE of 8.79%

  • The company has been able to generate a Return on Equity (avg) of 8.79% signifying low profitability per unit of shareholders funds
2

Poor long term growth as Net Sales has grown by an annual rate of -1.35% over the last 5 years

 
3

Negative results in Jun 26

4

Despite the size of the company, domestic mutual funds hold only 0.01% of the company

5

Underperformed the market in the last 1 year

stock-summaryMojo Parameters

Mojo Parameters

Loading Valuation Snapshot...

Stock DNA

stock-summary
Industry

Ferrous Metals

stock-summary
Market cap

INR 2,289 Cr (Small Cap)

stock-summary
P/E

8.00

stock-summary
Industry P/E

24

stock-summary
Dividend Yield

1.10%

stock-summary
Debt Equity

0.09

stock-summary
Return on Equity

8.72%

stock-summary
Price to Book

0.68

Revenue and Profits:
Net Sales:
1,032 Cr
(Quarterly Results - Jun 2026)
Net Profit:
71 Cr
stock-summaryTotal Returns
Total Returns (Price + Dividend) stock-summary
Dividend Yield (1.1%)
TimePeriod
Price Return
Dividend Return
Total Return
3 Months
-12.65%
0%
-12.65%
6 Months
-3.4%
0%
-3.4%
1 Year
-20.27%
0.93%
-19.34%
2 Years
-31.14%
1.17%
-29.97%
3 Years
42.17%
2.08%
44.25%
4 Years
145.77%
4.68%
150.45%
5 Years
74.47%
3.92%
78.39%

Latest dividend: 1.5 per share ex-dividend date: Sep-17-2025

Risk Adjusted Returns v/s stock-summary
Returns Beta
Icon
Beta has not been calculated since enough price history is not available
stock-summaryNews & Corporate Actions

News

Prakash Industries Gains 5.74%: 4 Key Factors Driving the Week’s Volatility

Announcements stock-summary

Announcement under Regulation 30 (LODR)-Newspaper Publication

12-Aug-2026 | Source : BSE

Newspaper Publication

Board Meeting Outcome for Outcome Of Board Meeting Held On 11Th August 2026

11-Aug-2026 | Source : BSE

Unaudited Financial Results with Limited Review for the quarter ended 30.06.2026

Unaudited Financial Results With Limited Review For The Quarter Ended 30.06.2026

11-Aug-2026 | Source : BSE

Unaudited Financial Results With Limited Review For The Quarter Ended 30.06.2026

Corporate Actions stock-summary

stock-summary
BOARD MEETING

No Upcoming Board Meetings

stock-summary
DIVIDEND

Prakash Industries Ltd has declared 15% dividend, ex-date: 17 Sep 25

stock-summary
SPLITS

No Splits history available

stock-summary
BONUS

No Bonus history available

stock-summary
RIGHTS

No Rights history available

stock-summaryKey Factors

Quality key factors stock-summary

Factor
Value
Sales Growth (5y)
-1.35%
EBIT Growth (5y)
12.61%
EBIT to Interest (avg)
5.79
Debt to EBITDA (avg)
1.19
Net Debt to Equity (avg)
0.09
Sales to Capital Employed (avg)
1.04
Tax Ratio
5.74%
Dividend Payout Ratio
7.56%
Pledged Shares
8.65%
Institutional Holding
3.75%
ROCE (avg)
8.53%
ROE (avg)
8.79%

Valuation key factors

Factor
Value
P/E Ratio
8
Industry P/E
24
Price to Book Value
0.68
EV to EBIT
7.81
EV to EBITDA
5.28
EV to Capital Employed
0.71
EV to Sales
0.80
PEG Ratio
NA
Dividend Yield
1.10%
ROCE (Latest)
8.84%
ROE (Latest)
8.72%

Technicals key factors

Indicator
Weekly
Monthly
MACD
Bearish
Bearish
RSI
No Signal
No Signal
Bollinger Bands
Mildly Bearish
Mildly Bearish
Moving Averages
Mildly Bearish (Daily)
KST
Bearish
Bearish
Dow Theory
No Trend
Mildly Bearish
OBV
Mildly Bullish
No Trend
stock-summary Technical Indicator Scale: Bearish, Mildly Bearish, Sideways, Mildly Bullish, Bullish  Turned 
stock-summaryShareholding
Shareholding Snapshot : Jun 2026stock-summary
Shareholding Compare (%holding) stock-summary
Majority shareholders

Non Institution

Pledged Promoter Holdings

8.6471

Mutual Funds

Held by 6 Schemes (0.01%)

FIIs

Held by 54 FIIs (3.71%)

Promoter with highest holding

Ved Prakash Agarwal (12.49%)

Highest Public shareholder

Dolly Khanna (2.12%)

Individual Investors Holdings

34.5%

stock-summaryFinancial
[
  {
    "link": "quarterly",
    "btn_text": "All Quarterly Results",
    "header": "Quarterly Results Snapshot (Standalone) - Jun'26 - QoQ",
    "rhs": [
      {
        "prefix": "Net Sales ",
        "suffix": "QoQ Growth in quarter ended Jun 2026 is 12.19% vs 15.19% in Mar 2026",
        "dir": -1
      },
      {
        "prefix": "Standalone Net Profit ",
        "suffix": "QoQ Growth in quarter ended Jun 2026 is -23.63% vs 7.45% in Mar 2026",
        "dir": -1
      }
    ],
    "table": {
      "header": [
        "Jun'26",
        "Mar'26",
        "Change(%)"
      ],
      "body": [
        {
          "field": "Net Sales",
          "val1": "1,032.00",
          "val2": "919.87",
          "chgp": "12.19%",
          "chgp_class": "positive"
        },
        {
          "field": "Operating Profit (PBDIT) excl Other Income",
          "val1": "147.34",
          "val2": "142.63",
          "chgp": "3.30%",
          "chgp_class": "positive"
        },
        {
          "field": "Interest",
          "val1": "18.43",
          "val2": "13.75",
          "chgp": "34.04%",
          "chgp_class": "negative"
        },
        {
          "field": "Exceptional Items",
          "val1": "0.00",
          "val2": "0.00",
          "chgp": "",
          "chgp_class": "neutral"
        },
        {
          "field": "Standalone Net Profit",
          "val1": "71.27",
          "val2": "93.32",
          "chgp": "-23.63%",
          "chgp_class": "negative"
        },
        {
          "field": "Operating Profit Margin (Excl OI)",
          "val1": "14.28%",
          "val2": "15.51%",
          "chgp": "-1.23%",
          "chgp_class": "negative"
        }
      ]
    }
  },
  {
    "link": "half-yearly",
    "btn_text": "All Half Yearly Results",
    "header": "Half Yearly Results Snapshot (Standalone) - Sep'25",
    "rhs": [
      {
        "prefix": "Net Sales ",
        "suffix": " Growth in half year ended Sep 2025 is -21.55% vs 17.95% in Sep 2024",
        "dir": -1
      },
      {
        "prefix": "Standalone Net Profit ",
        "suffix": " Growth in half year ended Sep 2025 is -15.43% vs 1.14% in Sep 2024",
        "dir": -1
      }
    ],
    "table": {
      "header": [
        "Sep'25",
        "Sep'24",
        "Change(%)"
      ],
      "body": [
        {
          "field": "Net Sales",
          "val1": "1,760.24",
          "val2": "2,243.76",
          "chgp": "-21.55%",
          "chgp_class": "negative"
        },
        {
          "field": "Operating Profit (PBDIT) excl Other Income",
          "val1": "246.19",
          "val2": "263.22",
          "chgp": "-6.47%",
          "chgp_class": "negative"
        },
        {
          "field": "Interest",
          "val1": "21.01",
          "val2": "23.57",
          "chgp": "-10.86%",
          "chgp_class": "positive"
        },
        {
          "field": "Exceptional Items",
          "val1": "0.00",
          "val2": "0.00",
          "chgp": "",
          "chgp_class": "neutral"
        },
        {
          "field": "Standalone Net Profit",
          "val1": "152.97",
          "val2": "180.88",
          "chgp": "-15.43%",
          "chgp_class": "negative"
        },
        {
          "field": "Operating Profit Margin (Excl OI)",
          "val1": "13.99%",
          "val2": "11.73%",
          "chgp": "2.26%",
          "chgp_class": "positive"
        }
      ]
    }
  },
  {
    "link": "nine-monthly",
    "btn_text": "All Nine Monthly Results",
    "header": "Nine Monthly Results Snapshot (Standalone) - Dec'25",
    "rhs": [
      {
        "prefix": "Net Sales ",
        "suffix": "YoY Growth in nine months ended Dec 2025 is -19.27% vs 13.72% in Dec 2024",
        "dir": -1
      },
      {
        "prefix": "Standalone Net Profit ",
        "suffix": "YoY Growth in nine months ended Dec 2025 is -9.37% vs 2.01% in Dec 2024",
        "dir": -1
      }
    ],
    "table": {
      "header": [
        "Dec'25",
        "Dec'24",
        "Change(%)"
      ],
      "body": [
        {
          "field": "Net Sales",
          "val1": "2,558.79",
          "val2": "3,169.71",
          "chgp": "-19.27%",
          "chgp_class": "negative"
        },
        {
          "field": "Operating Profit (PBDIT) excl Other Income",
          "val1": "370.66",
          "val2": "387.90",
          "chgp": "-4.44%",
          "chgp_class": "negative"
        },
        {
          "field": "Interest",
          "val1": "30.33",
          "val2": "35.38",
          "chgp": "-14.27%",
          "chgp_class": "positive"
        },
        {
          "field": "Exceptional Items",
          "val1": "0.00",
          "val2": "0.00",
          "chgp": "",
          "chgp_class": "neutral"
        },
        {
          "field": "Standalone Net Profit",
          "val1": "239.82",
          "val2": "264.62",
          "chgp": "-9.37%",
          "chgp_class": "negative"
        },
        {
          "field": "Operating Profit Margin (Excl OI)",
          "val1": "14.49%",
          "val2": "12.24%",
          "chgp": "2.25%",
          "chgp_class": "positive"
        }
      ]
    }
  },
  {
    "link": "annual",
    "btn_text": "All Annual Results",
    "header": "Annual Results Snapshot (Standalone) - Mar'26",
    "rhs": [
      {
        "prefix": "Net Sales ",
        "suffix": "YoY Growth in year ended Mar 2026 is -13.34% vs 9.15% in Mar 2025",
        "dir": -1
      },
      {
        "prefix": "Standalone Net Profit ",
        "suffix": "YoY Growth in year ended Mar 2026 is -6.28% vs 2.09% in Mar 2025",
        "dir": -1
      }
    ],
    "table": {
      "header": [
        "Mar'26",
        "Mar'25",
        "Change(%)"
      ],
      "body": [
        {
          "field": "Net Sales",
          "val1": "3,478.66",
          "val2": "4,014.35",
          "chgp": "-13.34%",
          "chgp_class": "negative"
        },
        {
          "field": "Operating Profit (PBDIT) excl Other Income",
          "val1": "513.29",
          "val2": "519.52",
          "chgp": "-1.20%",
          "chgp_class": "negative"
        },
        {
          "field": "Interest",
          "val1": "44.08",
          "val2": "46.34",
          "chgp": "-4.88%",
          "chgp_class": "positive"
        },
        {
          "field": "Exceptional Items",
          "val1": "0.00",
          "val2": "0.00",
          "chgp": "",
          "chgp_class": "neutral"
        },
        {
          "field": "Standalone Net Profit",
          "val1": "333.14",
          "val2": "355.45",
          "chgp": "-6.28%",
          "chgp_class": "negative"
        },
        {
          "field": "Operating Profit Margin (Excl OI)",
          "val1": "14.76%",
          "val2": "12.94%",
          "chgp": "1.82%",
          "chgp_class": "positive"
        }
      ]
    }
  }
]

Quarterly Results Snapshot (Standalone) - Jun'26 - QoQstock-summary

Jun'26
Mar'26
Change(%)
Net Sales
1,032.00
919.87
12.19%
Operating Profit (PBDIT) excl Other Income
147.34
142.63
3.30%
Interest
18.43
13.75
34.04%
Exceptional Items
0.00
0.00
Standalone Net Profit
71.27
93.32
-23.63%
Operating Profit Margin (Excl OI)
14.28%
15.51%
-1.23%
Values in Rs Cr.
Direction Arrows
Net Sales

QoQ Growth in quarter ended Jun 2026 is 12.19% vs 15.19% in Mar 2026

Direction Arrows
Standalone Net Profit

QoQ Growth in quarter ended Jun 2026 is -23.63% vs 7.45% in Mar 2026

Half Yearly Results Snapshot (Standalone) - Sep'25stock-summary

Sep'25
Sep'24
Change(%)
Net Sales
1,760.24
2,243.76
-21.55%
Operating Profit (PBDIT) excl Other Income
246.19
263.22
-6.47%
Interest
21.01
23.57
-10.86%
Exceptional Items
0.00
0.00
Standalone Net Profit
152.97
180.88
-15.43%
Operating Profit Margin (Excl OI)
13.99%
11.73%
2.26%
Values in Rs Cr.
Direction Arrows
Net Sales

Growth in half year ended Sep 2025 is -21.55% vs 17.95% in Sep 2024

Direction Arrows
Standalone Net Profit

Growth in half year ended Sep 2025 is -15.43% vs 1.14% in Sep 2024

Nine Monthly Results Snapshot (Standalone) - Dec'25stock-summary

Dec'25
Dec'24
Change(%)
Net Sales
2,558.79
3,169.71
-19.27%
Operating Profit (PBDIT) excl Other Income
370.66
387.90
-4.44%
Interest
30.33
35.38
-14.27%
Exceptional Items
0.00
0.00
Standalone Net Profit
239.82
264.62
-9.37%
Operating Profit Margin (Excl OI)
14.49%
12.24%
2.25%
Values in Rs Cr.
Direction Arrows
Net Sales

YoY Growth in nine months ended Dec 2025 is -19.27% vs 13.72% in Dec 2024

Direction Arrows
Standalone Net Profit

YoY Growth in nine months ended Dec 2025 is -9.37% vs 2.01% in Dec 2024

Annual Results Snapshot (Standalone) - Mar'26stock-summary

Mar'26
Mar'25
Change(%)
Net Sales
3,478.66
4,014.35
-13.34%
Operating Profit (PBDIT) excl Other Income
513.29
519.52
-1.20%
Interest
44.08
46.34
-4.88%
Exceptional Items
0.00
0.00
Standalone Net Profit
333.14
355.45
-6.28%
Operating Profit Margin (Excl OI)
14.76%
12.94%
1.82%
Values in Rs Cr.
Direction Arrows
Net Sales

YoY Growth in year ended Mar 2026 is -13.34% vs 9.15% in Mar 2025

Direction Arrows
Standalone Net Profit

YoY Growth in year ended Mar 2026 is -6.28% vs 2.09% in Mar 2025

stock-summaryCompany CV
About Prakash Industries Ltd stock-summary

stock-summary
Prakash Industries Ltd
Small Cap
Ferrous Metals
Prakash Industries Limited (PIL) was incorporated on July 31, 1980 as Prakash Pipes and Industries Limited. The Company formerly known as PIL Limited was changed to Prakash Industries Limited. The Company is presently engaged in manufacture and sale of Steel Products and generation of Power. PIL came out with a public issue in Nov.'91 to part-finance the sponge iron project being set up at Champa, Madhya Pradesh, with an installed capacity of 1.5 lac tpa.
Company Coordinates stock-summary
Company Details
15 Km Stone, Delhi Road Hissar Haryana : 125044
stock-summary
Tel: 91-11-28062115/28062116
stock-summary
investorshelpline@prakash.com
Registrar Details
Prakash Industries Ltd., 15 Km Stone, New Delhi Road, Hissar