
Compare Maithan Alloys with Similar Stocks
Dashboard
The company is Net-Debt Free
Poor long term growth as Operating profit has grown by an annual rate -3.13% of over the last 5 years
Flat results in Mar 26
With ROE of 10.5, it has a Fair valuation with a 0.8 Price to Book Value
Despite the size of the company, domestic mutual funds hold only 0% of the company
Consistent Underperformance against the benchmark over the last 3 years
Stock DNA
Ferrous Metals
INR 3,327 Cr (Small Cap)
7.00
13
1.48%
-0.37
10.46%
0.81
Total Returns (Price + Dividend) 
Latest dividend: 11 per share ex-dividend date: May-22-2026
Risk Adjusted Returns v/s
Returns Beta

News
Maithan Alloys Ltd. Upgraded to Hold as Technicals Improve Amid Mixed Financials
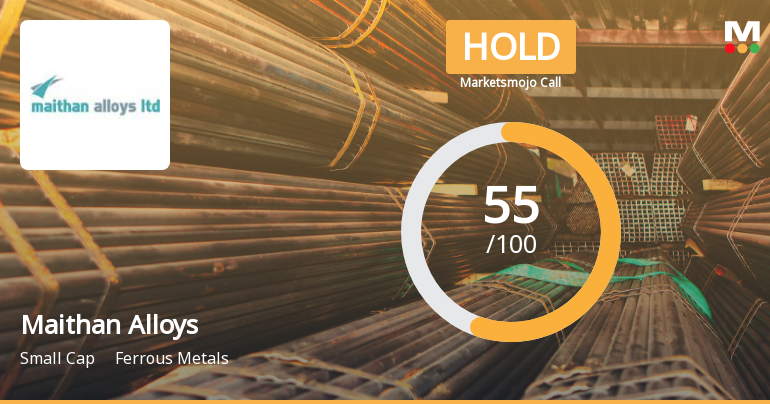
Maithan Alloys Ltd., a small-cap player in the ferrous metals sector, has seen its investment rating upgraded from Sell to Hold as of 15 June 2026. This change reflects a nuanced improvement across technical indicators and valuation metrics, despite ongoing challenges in financial performance and long-term growth. The company’s current Mojo Score stands at 55.0, signalling a cautious but more optimistic stance among analysts.
Read full news article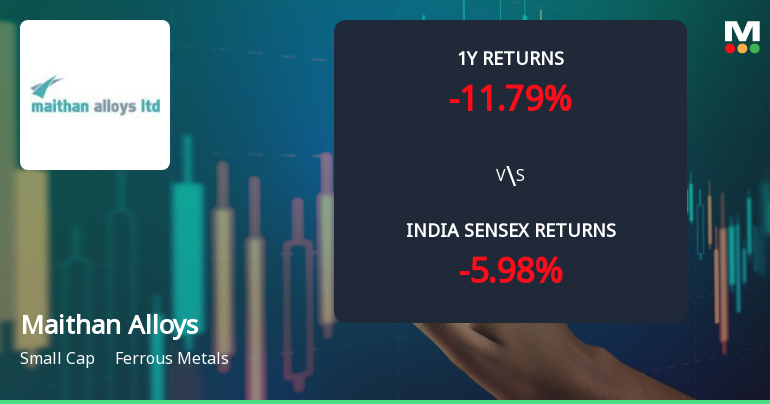
Maithan Alloys Ltd. Exhibits Shift to Mildly Bullish Momentum Amid Technical Upgrades
Maithan Alloys Ltd., a small-cap player in the ferrous metals sector, has witnessed a notable shift in its technical momentum, moving from a sideways trend to a mildly bullish stance. This change is underscored by a 4.72% gain in the stock price on 16 Jun 2026, closing at ₹1,062.80, up from the previous close of ₹1,014.85. The evolving technical indicators suggest a cautiously optimistic outlook for investors, despite mixed signals across different timeframes.
Read full news article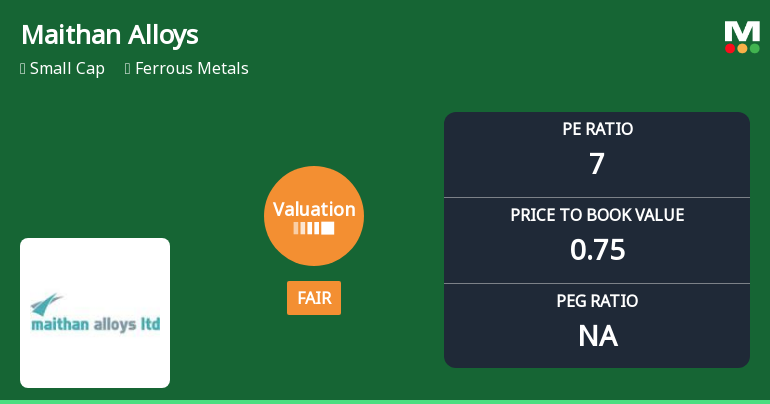
Maithan Alloys Ltd: Valuation Shift Signals Renewed Investor Interest Amid Sector Challenges
Maithan Alloys Ltd., a small-cap player in the ferrous metals sector, has witnessed a notable shift in its valuation parameters, prompting an upgrade in its investment grade from Sell to Hold. With its price-to-earnings (P/E) ratio now at 7.15 and price-to-book value (P/BV) at 0.75, the company’s valuation has moved from attractive to fair, reflecting a recalibration of investor sentiment amid improving fundamentals and market performance.
Read full news article Announcements
Announcement under Regulation 30 (LODR)-Scheme of Arrangement
11-Jun-2026 | Source : BSEAn update on the Scheme of Amalgamation/Merger between Impex Metal & Ferro Alloys Limited and Maithan Alloys Limited.
Announcement under Regulation 30 (LODR)-Acquisition
10-Jun-2026 | Source : BSEAcquisition of Equity Shares through Stock Exchange.
Announcement under Regulation 30 (LODR)-Newspaper Publication
28-May-2026 | Source : BSENewspaper publication regarding prior intimation for transfer of shares to the Investor Education and Protection Funds.
Corporate Actions

No Upcoming Board Meetings

Maithan Alloys Ltd. has declared 110% dividend, ex-date: 22 May 26

No Splits history available

Maithan Alloys Ltd. has announced 1:1 bonus issue, ex-date: 15 Jul 15

No Rights history available
Quality key factors
Valuation key factors
Technicals key factors
 Technical Indicator Scale: Bearish, Mildly Bearish, Sideways, Mildly Bullish, Bullish Turned
 Shareholding Snapshot : Dec 2025
Shareholding Compare (%holding)
Promoters
None
Held by 0 Schemes
Held by 41 FIIs (1.24%)
Subhas Chandra Agarwalla (25.63%)
None
18.55%
Quarterly Results Snapshot (Consolidated) - Mar'26 - QoQ

QoQ Growth in quarter ended Mar 2026 is 14.05% vs -0.11% in Dec 2025

QoQ Growth in quarter ended Mar 2026 is -179.24% vs 173.50% in Dec 2025
Half Yearly Results Snapshot (Consolidated) - Sep'25
Growth in half year ended Sep 2025 is 33.82% vs -0.95% in Sep 2024
Growth in half year ended Sep 2025 is -30.84% vs 393.97% in Sep 2024
Nine Monthly Results Snapshot (Consolidated) - Dec'25
YoY Growth in nine months ended Dec 2025 is 17.73% vs 5.79% in Dec 2024
YoY Growth in nine months ended Dec 2025 is -27.07% vs 234.11% in Dec 2024
Annual Results Snapshot (Consolidated) - Mar'26
YoY Growth in year ended Mar 2026 is 20.32% vs 4.45% in Mar 2025
YoY Growth in year ended Mar 2026 is -31.19% vs 80.59% in Mar 2025
About Maithan Alloys Ltd.

Company Coordinates


