
Compare Sunflag Iron with Similar Stocks
Dashboard
Strong ability to service debt as the company has a low Debt to EBITDA ratio of 1.10 times
Poor long term growth as Operating profit has grown by an annual rate 14.60% of over the last 5 years
Flat results in Mar 26
With ROE of 2.4, it has a Very Expensive valuation with a 0.7 Price to Book Value
Despite the size of the company, domestic mutual funds hold only 0.04% of the company
Consistent Returns over the last 3 years
Stock DNA
Ferrous Metals
INR 6,388 Cr (Small Cap)
29.00
25
0.21%
0.03
2.36%
0.69
Total Returns (Price + Dividend) 
Latest dividend: 0.7 per share ex-dividend date: Sep-12-2025
Risk Adjusted Returns v/s
Returns Beta

News
Sunflag Iron & Steel Company Ltd Surges 8.32% to Day's High of Rs 349.85 — Outperforms Sector by 2.32 Percentage Points
The Sensex advanced 0.57% on 2 Jul 2026, yet Sunflag Iron & Steel Company Ltd outpaced the broader market with an 8.32% gain, reaching an intraday peak of Rs 349.85. This 2.32 percentage-point outperformance over its Ferrous Metals sector peers highlights a distinctly stock-specific rally rather than a market-wide lift.
Read full news article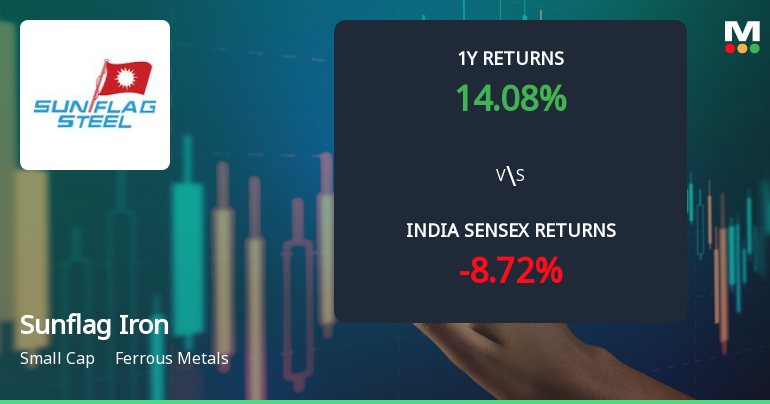
Sunflag Iron & Steel Company Ltd: Technical Momentum Shifts Amid Mixed Market Signals
Sunflag Iron & Steel Company Ltd has experienced a nuanced shift in its technical momentum, moving from a bullish to a mildly bullish stance as of late June 2026. Despite a recent day decline of 1.46%, the stock’s technical indicators present a complex picture, with some metrics signalling strength while others suggest caution. This analysis delves into the latest technical parameters, price momentum, and comparative returns to provide investors with a comprehensive view of the stock’s current positioning within the ferrous metals sector.
Read full news article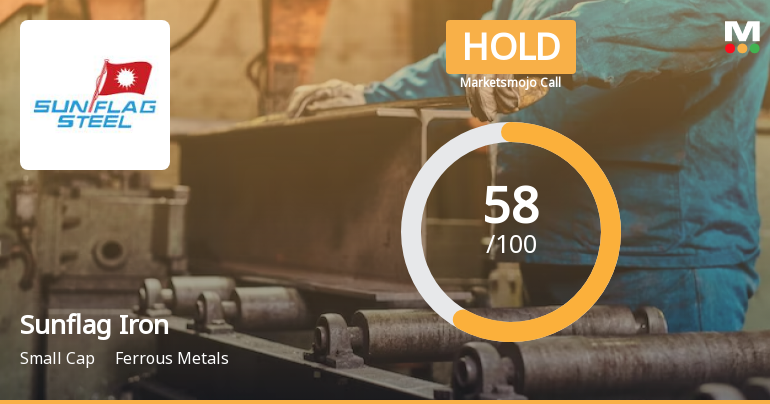
Sunflag Iron & Steel Company Ltd is Rated Hold
Sunflag Iron & Steel Company Ltd is rated 'Hold' by MarketsMOJO, with this rating last updated on 27 April 2026. However, the analysis and financial metrics discussed here reflect the stock's current position as of 22 June 2026, providing investors with an up-to-date view of the company’s fundamentals, returns, and market standing.
Read full news article Announcements
Closure of Trading Window
20-Jun-2026 | Source : BSEIntimation of Closure of Trading window pursuant to SEBI (Prohibition of Insider Trading) Regulations 2015
Announcement under Regulation 30 (LODR)-Newspaper Publication
30-May-2026 | Source : BSECopies of Newspaper publication for -Standalone and Consolidated Audited Financial Results for the Quarter and Financial Year ended 31st March 2026 and - Information to members about opening of Special window for Transter and Dematerialisation of physical Shares
Board Meeting Outcome for Outcome Of The 206Th Board Meeting - Friday The 29Th May 2026 At 33/1 Mount Road Sadar Nagpur - 440001
29-May-2026 | Source : BSEDisclosure pursuant to Regulation 30 read with Regulation 33 of the Securities and Exchange Board of India (Listing Obligations and Disclosure Requirements) Regulations 2015 - Outcome of the 206th Board Meeting - Friday the 29th May 2026 at 33/1 Mount Road Sadar Nagpur - 440001
Corporate Actions

No Upcoming Board Meetings

Sunflag Iron & Steel Company Ltd has declared 7% dividend, ex-date: 12 Sep 25

No Splits history available

No Bonus history available

No Rights history available
Quality key factors
Valuation key factors
Technicals key factors
 Technical Indicator Scale: Bearish, Mildly Bearish, Sideways, Mildly Bullish, Bullish Turned
 Shareholding Snapshot : Mar 2026
Shareholding Compare (%holding)
Promoters
None
Held by 4 Schemes (0.02%)
Held by 33 FIIs (0.54%)
Sunflag Ltd (36.21%)
Daido Steel Co Ltd (10%)
32.62%
Quarterly Results Snapshot (Consolidated) - Mar'26 - QoQ

QoQ Growth in quarter ended Mar 2026 is 6.18% vs -3.14% in Dec 2025

QoQ Growth in quarter ended Mar 2026 is -42.83% vs 31.65% in Dec 2025
Half Yearly Results Snapshot (Consolidated) - Sep'25
Growth in half year ended Sep 2025 is 13.39% vs 7.18% in Sep 2024
Growth in half year ended Sep 2025 is 57.45% vs 6.27% in Sep 2024
Nine Monthly Results Snapshot (Consolidated) - Dec'25
YoY Growth in nine months ended Dec 2025 is 10.79% vs 6.26% in Dec 2024
YoY Growth in nine months ended Dec 2025 is 41.46% vs 18.12% in Dec 2024
Annual Results Snapshot (Consolidated) - Mar'26
YoY Growth in year ended Mar 2026 is 11.42% vs 3.52% in Mar 2025
YoY Growth in year ended Mar 2026 is 24.86% vs 12.89% in Mar 2025
About Sunflag Iron & Steel Company Ltd

Company Coordinates


