
Compare Prime Industries with Similar Stocks
Total Returns (Price + Dividend) 
Prime Industries for the last several years.
Risk Adjusted Returns v/s
Returns Beta

News

Prime Industries Ltd Upgraded to Sell on Improved Valuation and Financial Metrics
Prime Industries Ltd, a micro-cap player in the edible oil sector, has seen its investment rating upgraded from Strong Sell to Sell as of 1 June 2026. This change reflects a significant improvement in valuation metrics, even as the company’s recent financial performance remains flat. Investors are advised to weigh the attractive valuation against ongoing operational challenges and market underperformance.
Read full news article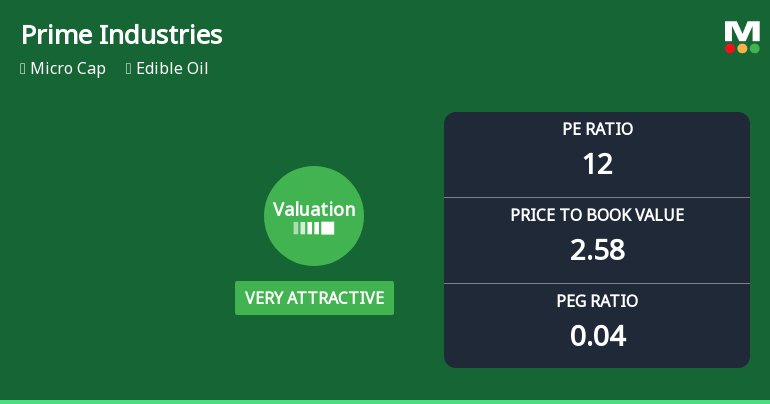
Prime Industries Ltd Valuation Shifts Signal Renewed Price Attractiveness
Prime Industries Ltd, a micro-cap player in the edible oil sector, has witnessed a significant shift in its valuation parameters, moving from a risky to a very attractive valuation grade. This change is underpinned by improved price-to-earnings (P/E) and price-to-book value (P/BV) ratios, alongside robust return metrics, signalling a potential reappraisal of the stock’s price attractiveness despite recent mixed returns against the broader market.
Read full news articleAre Prime Industries Ltd latest results good or bad?
Prime Industries Ltd's latest financial results for Q4 FY26 reflect a complex operational landscape. The company reported a sequential revenue growth of 5.26%, reaching ₹27.62 crores, which indicates some positive movement in sales. However, this revenue growth was overshadowed by a significant decline in profitability, as the net profit fell to ₹1.44 crores, marking a 57.14% decrease from the previous quarter. The operating margin also experienced a substantial contraction, dropping from 24.12% to 12.13%. This compression in margins suggests that the company is facing rising cost pressures or operational inefficiencies that it has not been able to counteract effectively. The profit after tax margin similarly decreased to 10.97%, further highlighting the challenges in maintaining profitability despite the modest revenue growth. The financial performance of Prime Industries showcases a troubling pattern o...
Read full news article Announcements
Announcement under Regulation 30 (LODR)-Newspaper Publication
31-May-2026 | Source : BSENewspaper Publication of Audited Financial Results for the Quarter and Financial Year ended 31st March 2026.
Compliances-Reg.24(A)-Annual Secretarial Compliance
30-May-2026 | Source : BSEAnnual Secretarial Compliance Report for the Financial Year ended 31st March 2026.
Board Meeting Outcome for Outcome Of Board Meeting Held On Friday 29Th Day Of May 2026.
29-May-2026 | Source : BSEOutcome of Board Meeting held on Friday 29th Day of May 2026 for Financial Results (Standalone & Consolidated) for Quarter and Financial year ended 31st March 2026
Corporate Actions

No Upcoming Board Meetings

No Dividend history available

Prime Industries Ltd has announced 5:10 stock split, ex-date: 12 Sep 19

No Bonus history available

No Rights history available
Quality key factors
Valuation key factors
Technicals key factors
 Technical Indicator Scale: Bearish, Mildly Bearish, Sideways, Mildly Bullish, Bullish Turned
 Shareholding Snapshot : Mar 2026
Shareholding Compare (%holding)
Non Institution
None
Held by 0 Schemes
Held by 0 FIIs
Rajinder Kumar Singhania (6.24%)
Race Eco Chain Limited (20.71%)
34.98%
Quarterly Results Snapshot (Standalone) - Mar'26 - QoQ

QoQ Growth in quarter ended Mar 2026 is -58.22% vs -52.83% in Dec 2025
QoQ Growth in quarter ended Mar 2026 is -13.16% vs 26.67% in Dec 2025
Half Yearly Results Snapshot (Standalone) - Sep'25

Growth in half year ended Sep 2025 is 0.00% vs -100.00% in Sep 2024
Growth in half year ended Sep 2025 is 61.11% vs -96.59% in Sep 2024
Nine Monthly Results Snapshot (Standalone) - Dec'25
YoY Growth in nine months ended Dec 2025 is 0.00% vs -100.00% in Dec 2024
YoY Growth in nine months ended Dec 2025 is -18.64% vs -89.30% in Dec 2024
Annual Results Snapshot (Standalone) - Mar'26
YoY Growth in year ended Mar 2026 is 0.00% vs -100.00% in Mar 2025
YoY Growth in year ended Mar 2026 is -12.24% vs -86.44% in Mar 2025
About Prime Industries Ltd

Company Coordinates


