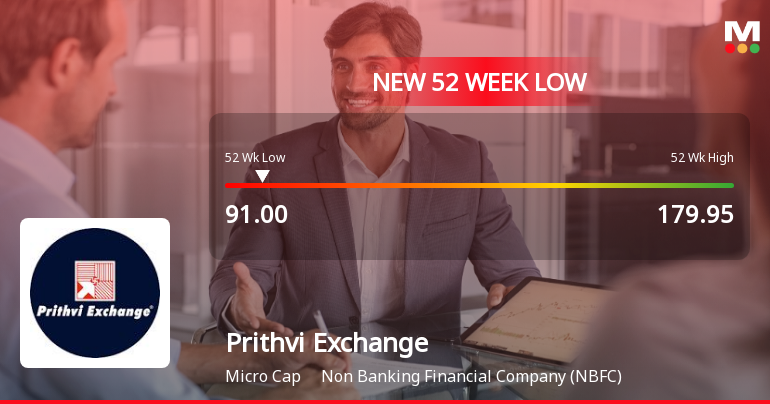
Prithvi Exchange

  • Market Cap: Micro Cap
  • Industry: Non Banking Financial Company (NBFC)
  • ISIN: INE621B01021
  • NSEID: PRITHVISOF
  • BSEID: 531688
INR
96.00
0.08 (0.08%)
BSENSE

Aug 20, 12:35 PM

BSE+NSE Vol: 1.29 k

  • Price Points
  • Score
  • Mojo Parameters
  • Total Return
  • News and Corporate Actions
  • Key factors
  • Shareholding
  • Financials
  • CompanyCV
stock-summaryPrice Point
High/Low

1Day

52 Week

Valuation
Technical
Day's Volume

CASH

1.29 k (-25.40%) Volume

Shareholding (Jun 2026)

FII

0.00%

Held by 0 FIIs

DII

0.00%

Held by 0 DIIs

Promoter

72.02%

Why is Prithvi Exchange (India) Ltd falling/rising?

20-Aug-2026

As of 19-Aug, Prithvi Exchange (India) Ltd's stock price is declining at 95.92, down 1.1%, with significant year-to-date and one-year decreases of 18.33% and 24.65%, respectively. The stock is trading below its moving averages, indicating a bearish trend, despite increased investor participation.

As of 19-Aug, Prithvi Exchange (India) Ltd is experiencing a decline in its stock price, currently at 95.92, which reflects a change of -1.07 or -1.1%. This downward movement is consistent with the stock's performance over various periods, showing a significant year-to-date decline of -18.33% and a one-year decrease of -24.65%. <BR><BR>Additionally, the stock is trading below its moving averages across multiple time frames, including the 5-day, 20-day, 50-day, 100-day, and 200-day averages, indicating a bearish trend. Despite a notable increase in investor participation, with delivery volume rising by 1045.58% compared to the 5-day average, the overall performance remains weak. The stock's performance today is described as inline with the sector, but the broader context of negative returns over the past week, month, and year suggests that the stock is facing challenges that are contributing to its current decline.

View full answer

Who are in the management team of Prithvi Exchange?

14-Aug-2026

The management team of Prithvi Exchange includes Deendayalan K N (Independent Director), D Suresh Kumar (Director), Anuradha Jayaraman (Independent Director), Pavan Kumar Kavad (Whole-time Director), Mahavir Chand (Independent Director), Kalpesh Kumar Kavad (Whole Time Director & CFO), N. Sornalatha (Company Secretary & Compliance Officer), and Naresh Kumar Khivraj (Additional Director). They oversee the company's operations and strategic direction.

The management team of Prithvi Exchange includes the following individuals:<BR><BR>1. **Deendayalan K N** - Independent Director<BR>2. **D Suresh Kumar** - Director<BR>3. **Anuradha Jayaraman** - Independent Director<BR>4. **Pavan Kumar Kavad** - Whole-time Director<BR>5. **Mahavir Chand** - Independent Director<BR>6. **Kalpesh Kumar Kavad** - Whole Time Director & CFO<BR>7. **N. Sornalatha** - Company Secretary & Compliance Officer<BR>8. **Naresh Kumar Khivraj** - Additional Director<BR><BR>This team is responsible for overseeing the company's operations and strategic direction.

View full answer

What does Prithvi Exchange do?

14-Aug-2026

Prithvi Exchange (India) Ltd is a Non-Banking Financial Company specializing in foreign exchange services, with a market cap of INR 86 Cr and reported net sales of 1,108 Cr and net profit of 1 Cr for June 2026. The company was incorporated in 1995 and rebranded in 2016.

Overview:<BR>Prithvi Exchange (India) Ltd operates in the Non Banking Financial Company (NBFC) sector, specializing in foreign exchange services.<BR><BR>History:<BR>Incorporated in June 1995, the company was formerly known as Prithvi Softech Limited and changed its name to Prithvi Exchange (India) Limited in 2016. The latest quarterly results reported net sales and net profit for June 2026.<BR><BR>Financial Snapshot:<BR>Net Sales: 1,108 Cr (Quarterly Results - Jun 2026) <BR>Net Profit: 1 Cr (Quarterly Results - Jun 2026) <BR>Market Cap: INR 86 Cr (Micro Cap)<BR><BR>Key Metrics:<BR>P/E: 28.00 <BR>Industry P/E: 21 <BR>Dividend Yield: 2.38% <BR>Debt Equity: -0.34 <BR>Return on Equity: 6.42% <BR>Price to Book: 1.63 <BR><BR>Contact Details:<BR>Address: No 11, East Spur Tank Road Chetpet Chennai Tamil Nadu : 600031 <BR>Tel: 91-044-43434250/52 <BR>Email: investor.relations@prithvifx.com <BR>Website: http://www.prithvifx.com

View full answer

Who are the peers of the Prithvi Exchange?

14-Aug-2026

Prithvi Exchange's peers include Inter Globe Fin, R R Fin. Cons., B N Rathi Sec., Charter. Capital, and others, with varying management and growth risks. GACM Tech leads in 1-year returns at 56.25%, while Prithvi Exchange has a return of -22.27%.

Peers: The peers of Prithvi Exchange are Inter Globe Fin, R R Fin. Cons., B N Rathi Sec., Charter. Capital, Mangalam Industr, BLB, GACM Tech, Paras Petrofils, and Saumya Cons.<BR><BR>Quality Snapshot: Excellent management risk is observed at Charter. Capital and My Mudra Fin., while Good management risk is found at Prithvi Exchange. Below Average management risk is noted for Inter Globe Fin, R R Fin. Cons., B N Rathi Sec., Mangalam Industr, BLB, GACM Tech, Saumya Cons, and the rest. In terms of Growth, Excellent growth is seen at Charter. Capital and GACM Tech, Good growth is noted at Prithvi Exchange and R R Fin. Cons., Average growth is found at B N Rathi Sec. and the rest, while Below Average growth is observed at Mangalam Industr and Saumya Cons. All peers have an Excellent capital structure except for Paras Petrofils, which does not qualify.<BR><BR>Return Snapshot: GACM Tech has the highest 1-year return at 56.25%, while Mangalam Industr has the lowest at -56.06%. Prithvi Exchange's 1-year return is -22.27%, which is better than Mangalam Industr but worse than GACM Tech. Additionally, the six-month return is negative for Mangalam Industr, Prithvi Exchange, and Saumya Cons.

View full answer

How big is Prithvi Exchange?

14-Aug-2026

As of 14th August, Prithvi Exchange (India) Ltd has a market capitalization of 87.00 Cr, with recent net sales of 3982.97 Cr and a net profit of 2.23 Cr over the last four quarters.

As of 14th August, <BR><BR>Market Cap: Prithvi Exchange (India) Ltd has a market capitalization of 87.00 Cr, classifying it as a Micro Cap company.<BR><BR>Recent Quarterly Performance: The sum of Net Sales for the latest 4 quarters is 3982.97 Cr, while the sum of Net Profit for the same period is 2.23 Cr.<BR><BR>Balance Sheet Snapshot: The reporting period is March 2026, with Shareholder's Funds amounting to 53.11 Cr and Total Assets valued at 75.90 Cr.

View full answer

Should I buy, sell or hold Prithvi Exchange (India) Ltd?

09-Aug-2026

Are Prithvi Exchange (India) Ltd latest results good or bad?

08-Aug-2026

Prithvi Exchange (India) Ltd's latest results are concerning, showing a net loss of ₹0.39 crores in Q4 FY26 despite a 30.42% revenue growth to ₹940.77 crores, indicating severe operational challenges and a significant drop in profitability. Investors should be cautious as the company's operational efficiency and margins have deteriorated.

The latest results for Prithvi Exchange (India) Ltd indicate a concerning trend. In Q4 FY26, the company reported a net loss of ₹0.39 crores, a significant decline from a profit of ₹0.66 crores in the previous quarter, marking a drastic 159.09% decrease in profitability. While revenue did increase to ₹940.77 crores, reflecting a 30.42% year-on-year growth, the inability to convert this revenue into profit raises serious questions about operational efficiency and margin compression.<BR><BR>The operating margin collapsed to effectively zero, and the profit before tax also turned negative, highlighting severe operational challenges. The company’s return on equity has dropped significantly to just 5.76%, compared to its five-year average of 16.53%, indicating deteriorating capital efficiency.<BR><BR>Overall, while revenue growth is positive, the collapse in profitability and operational margins suggests that the results are more bad than good. Investors should be cautious and closely monitor the company's performance in the upcoming quarters to see if it can address these critical issues.

View full answer

Has Prithvi Exchange (India) Ltd declared dividend?

02-Feb-2026

Yes, Prithvi Exchange (India) Ltd has declared a 15% dividend, with an ex-date of February 9, 2026. Despite recent negative price returns, the company has shown significant long-term growth, particularly over the last 3 to 5 years.

Prithvi Exchange (India) Ltd has declared a 15% dividend.<BR><BR>Dividend Details:<BR>- Percentage announced: 15%<BR>- Ex-date: 09 Feb 26<BR><BR>Dividend Yield: 2.02%.<BR><BR>Total Returns by Period:<BR>Over the last 3 months, the company experienced a price return of -25.23%, a dividend return of 1.15%, resulting in a total return of -24.08%.<BR><BR>In the past 6 months, the price return was -34.29%, with a dividend return of 1.88%, leading to a total return of -32.41%.<BR><BR>For the 1-year period, the price return stood at -51.27%, while the dividend return was 1.82%, culminating in a total return of -49.45%.<BR><BR>Over 2 years, the price return was -43.94%, with a dividend return of 3.19%, resulting in a total return of -40.75%.<BR><BR>In the 3-year period, the company saw a price return of 88.79%, a dividend return of 10.59%, and a total return of 99.38%.<BR><BR>For the 4-year period, the price return was 195.84%, with a dividend return of 20.28%, leading to a total return of 216.12%.<BR><BR>In the last 5 years, the price return reached 306.78%, while the dividend return was 32.99%, resulting in a total return of 339.77%.<BR><BR>Overall, Prithvi Exchange (India) Ltd has declared a dividend, and despite recent negative price returns, the long-term total returns show significant growth, particularly over the last 3 to 5 years.

View full answer

How has been the historical performance of Prithvi Exchange?

12-Nov-2025

Prithvi Exchange has shown significant growth in net sales and profitability over the past five years, with net sales rising from 756.91 Cr in Mar'21 to 3,524.73 Cr in Mar'25, despite some volatility in cash flow and a decline in net profit in the most recent year. Operating profit improved from a loss of 2.12 Cr in Mar'21 to a profit of 11.88 Cr in Mar'25, peaking at 19.03 Cr in Mar'24.

Answer:<BR>The historical performance of Prithvi Exchange shows a fluctuating trend in key financial metrics over the past five years.<BR><BR>Breakdown:<BR>Prithvi Exchange's net sales increased from 756.91 Cr in Mar'21 to 3,524.73 Cr in Mar'25, peaking at 4,159.87 Cr in Mar'24 before declining. The total operating income followed a similar pattern, reaching 3,524.73 Cr in Mar'25 after a high of 4,159.87 Cr in Mar'24. The operating profit (PBDIT) saw a significant improvement from a loss of 2.12 Cr in Mar'21 to a profit of 11.88 Cr in Mar'25, although it was higher at 19.03 Cr in Mar'24. Profit before tax also rose from a loss of 2.53 Cr in Mar'21 to 10.87 Cr in Mar'25, with a peak of 18.19 Cr in Mar'24. The profit after tax followed suit, increasing from a loss of 1.89 Cr in Mar'21 to 8.02 Cr in Mar'25. The company's total assets grew from 31.52 Cr in Mar'21 to 69.72 Cr in Mar'25, while total liabilities increased from 31.52 Cr to 69.72 Cr in the same period. Cash flow from operating activities fluctuated, showing a negative cash flow of 1.00 Cr in Mar'25 after a positive flow of 7.00 Cr in Mar'24. Overall, Prithvi Exchange has demonstrated growth in sales and profitability, despite some volatility in cash flow and a decline in net profit in the most recent year.

View full answer

Is Prithvi Exchange overvalued or undervalued?

11-Nov-2025

As of November 10, 2025, Prithvi Exchange is fairly valued with a PE ratio of 34.19 and significant valuation challenges, especially in profitability, while its stock has declined 47.50% year-to-date compared to a 6.91% increase in the Sensex.

As of 10 November 2025, the valuation grade for Prithvi Exchange has moved from attractive to fair, indicating a reassessment of its market position. The company appears to be fairly valued at this time. Key ratios include a PE ratio of 34.19, a Price to Book Value of 0.20, and an EV to EBITDA of -40.17, which highlight significant valuation challenges, particularly in profitability metrics.<BR><BR>In comparison to peers, Prithvi Exchange's PE ratio is notably lower than that of Elitecon International, which stands at 359.8, and MMTC at 139.4, both of which are considered very expensive. Additionally, while Prithvi Exchange has a PEG ratio of 0.00, indicating no growth expectations, it is still positioned better than some peers like Blue Pearl Agri, which has an astronomical PE ratio. Recent stock performance has been disappointing, with a year-to-date decline of 47.50% compared to a 6.91% increase in the Sensex, reinforcing the notion that the stock is currently fairly valued amidst a challenging market environment.

View full answer

Who are the top shareholders of the Prithvi Exchange?

17-Jul-2025

The top shareholders of Prithvi Exchange include promoter Pavan Kumar Kavad with 18.3%, public shareholder Anitha with 3.45%, and individual investors holding a total of 23.68%. There are no mutual funds or foreign institutional investors involved, and no promoter holdings are pledged.

The top shareholders of Prithvi Exchange include Pavan Kumar Kavad, who is the promoter with the highest holding at 18.3%. The highest public shareholder is Anitha, holding 3.45%. Additionally, individual investors collectively hold 23.68% of the shares. There are no mutual funds or foreign institutional investors (FIIs) currently holding shares in the company, and there are no pledged promoter holdings.

View full answer

What is the technical trend for Prithvi Exchange?

09-Jun-2025

As of April 15, 2025, Prithvi Exchange's technical trend is mildly bearish, with mixed signals from MACD, Bollinger Bands, and moving averages, indicating weak momentum despite some short-term strength.

As of 15 April 2025, the technical trend for Prithvi Exchange has changed from bearish to mildly bearish. The weekly MACD indicates a mildly bullish stance, while the monthly MACD is mildly bearish, suggesting mixed signals across time frames. The Bollinger Bands are bearish on both weekly and monthly charts, reinforcing a negative outlook. Daily moving averages are bearish, which adds to the overall bearish sentiment. The KST shows a mildly bullish trend weekly but is mildly bearish monthly, indicating some short-term strength that is not reflected in the longer term. Dow Theory presents a mildly bearish view weekly and a mildly bullish view monthly, further complicating the overall assessment. The RSI shows no signals in both weekly and monthly time frames. Given the recent performance, including a significant decline in stock returns compared to the Sensex over various periods, the current technical stance remains mildly bearish with weak momentum.

View full answer

When is the next results date for Prithvi Exchange?

06-Jun-2025

No Upcoming Board Meetings

What is the bonus history of the Prithvi Exchange?

06-Jun-2025

Prithvi Exchange announced a 1:2 bonus issue on July 11, 2019, with a record date of July 12, 2019, meaning shareholders received one additional share for every two shares held.

Prithvi Exchange has a bonus history that includes a 1:2 bonus issue announced on July 11, 2019. The record date for this bonus was July 12, 2019. This means that for every two shares held, shareholders received one additional share as a bonus.

View full answer
iScoreScore
Click here to find our call on this stock
Strong Sell
Sell
Hold
Buy
Strong Buy

Dashboard

1

Flat results in Jun 26

  • ROCE(HY) Lowest at 7.72%
2

Below par performance in long term as well as near term

stock-summaryMojo Parameters

Mojo Parameters

Loading Valuation Snapshot...

Stock DNA

stock-summary
Industry

Non Banking Financial Company (NBFC)

stock-summary
Market cap

INR 79 Cr (Micro Cap)

stock-summary
P/E

26.00

stock-summary
Industry P/E

21

stock-summary
Dividend Yield

3.09%

stock-summary
Debt Equity

-0.34

stock-summary
Return on Equity

6.42%

stock-summary
Price to Book

1.51

Revenue and Profits:
Net Sales:
1,108 Cr
(Quarterly Results - Jun 2026)
Net Profit:
1 Cr
stock-summaryTotal Returns
Total Returns (Price + Dividend) stock-summary
Dividend Yield (3.09%)
TimePeriod
Price Return
Dividend Return
Total Return
3 Months
-16.38%
0.43%
-15.95%
6 Months
-17.24%
0.45%
-16.79%
1 Year
-24.68%
2.31%
-22.37%
2 Years
-79.46%
1.01%
-78.45%
3 Years
24.74%
10.06%
34.8%
4 Years
110.99%
16.39%
127.38%
5 Years
316.49%
29.17%
345.66%

Latest dividend: 0.5 per share ex-dividend date: Aug-19-2026

Risk Adjusted Returns v/s stock-summary
Returns Beta
Icon
Beta has not been calculated since enough price history is not available
stock-summaryNews & Corporate Actions

News

Announcements stock-summary

Company Has Been Granted A Perpetual License Under Authorised Dealer Category-II (AD-II) By The Reserve Bank Of India (RBI)

13-Aug-2026 | Source : BSE

Intimation attached

Announcement under Regulation 30 (LODR)-Investor Presentation

08-Aug-2026 | Source : BSE

Investor Presentation is attached

Board Meeting Outcome for Outcome Of Board Meeting Held On August 08 2026

08-Aug-2026 | Source : BSE

Outcome of the Board meeting is attached

Corporate Actions stock-summary

stock-summary
BOARD MEETING

No Upcoming Board Meetings

stock-summary
DIVIDEND

Prithvi Exchange (India) Ltd has declared 5% dividend, ex-date: 19 Aug 26

stock-summary
SPLITS

No Splits history available

stock-summary
BONUS

Prithvi Exchange (India) Ltd has announced 1:2 bonus issue, ex-date: 11 Jul 19

stock-summary
RIGHTS

No Rights history available

stock-summaryKey Factors

Quality key factors stock-summary

Factor
Value
Sales Growth (5y)
34.69%
EBIT Growth (5y)
22.59%
EBIT to Interest (avg)
7.24
Debt to EBITDA (avg)
Negative Net Debt
Net Debt to Equity (avg)
-0.34
Sales to Capital Employed (avg)
69.02
Tax Ratio
22.30%
Dividend Payout Ratio
10.29%
Pledged Shares
0
Institutional Holding
0
ROCE (avg)
30.17%
ROE (avg)
16.96%

Valuation key factors

Factor
Value
P/E Ratio
26
Industry P/E
21
Price to Book Value
1.51
EV to EBIT
28.81
EV to EBITDA
20.21
EV to Capital Employed
1.76
EV to Sales
0.02
PEG Ratio
NA
Dividend Yield
3.09%
ROCE (Latest)
7.70%
ROE (Latest)
6.42%

Technicals key factors

Indicator
Weekly
Monthly
MACD
Bearish
Bearish
RSI
No Signal
No Signal
Bollinger Bands
Bearish
Bearish
Moving Averages
Bearish (Daily)
KST
Bearish
Bearish
Dow Theory
Mildly Bearish
Mildly Bearish
stock-summary Technical Indicator Scale: Bearish, Mildly Bearish, Sideways, Mildly Bullish, Bullish  Turned 
stock-summaryShareholding
Shareholding Snapshot : Jun 2026stock-summary
Shareholding Compare (%holding) stock-summary
Majority shareholders

Promoters

Pledged Promoter Holdings

None

Mutual Funds

Held by 0 Schemes

FIIs

Held by 0 FIIs

Promoter with highest holding

Pavan Kumar Kavad (18.3%)

Highest Public shareholder

Anitha . (3.45%)

Individual Investors Holdings

23.73%

stock-summaryFinancial
[
  {
    "link": "quarterly",
    "btn_text": "All Quarterly Results",
    "header": "Quarterly Results Snapshot (Consolidated) - Jun'26 - QoQ",
    "rhs": [
      {
        "prefix": "Net Sales ",
        "suffix": "QoQ Growth in quarter ended Jun 2026 is 17.81% vs 3.09% in Mar 2026",
        "dir": 1
      },
      {
        "prefix": "Consolidated Net Profit ",
        "suffix": "QoQ Growth in quarter ended Jun 2026 is 287.18% vs -159.09% in Mar 2026",
        "dir": 1
      }
    ],
    "table": {
      "header": [
        "Jun'26",
        "Mar'26",
        "Change(%)"
      ],
      "body": [
        {
          "field": "Net Sales",
          "val1": "1,108.30",
          "val2": "940.77",
          "chgp": "17.81%",
          "chgp_class": "positive"
        },
        {
          "field": "Operating Profit (PBDIT) excl Other Income",
          "val1": "0.94",
          "val2": "0.04",
          "chgp": "2,250.00%",
          "chgp_class": "positive"
        },
        {
          "field": "Interest",
          "val1": "0.06",
          "val2": "0.11",
          "chgp": "-45.45%",
          "chgp_class": "positive"
        },
        {
          "field": "Exceptional Items",
          "val1": "0.00",
          "val2": "-0.79",
          "chgp": "100.00%",
          "chgp_class": "positive"
        },
        {
          "field": "Consolidate Net Profit",
          "val1": "0.73",
          "val2": "-0.39",
          "chgp": "287.18%",
          "chgp_class": "positive"
        },
        {
          "field": "Operating Profit Margin (Excl OI)",
          "val1": "0.09%",
          "val2": "0.00%",
          "chgp": "0.09%",
          "chgp_class": "positive"
        }
      ]
    }
  },
  {
    "link": "half-yearly",
    "btn_text": "All Half Yearly Results",
    "header": "Half Yearly Results Snapshot (Consolidated) - Sep'25",
    "rhs": [
      {
        "prefix": "Net Sales ",
        "suffix": " Growth in half year ended Sep 2025 is -10.03% vs -0.09% in Sep 2024",
        "dir": -1
      },
      {
        "prefix": "Consolidated Net Profit ",
        "suffix": " Growth in half year ended Sep 2025 is -67.76% vs 31.89% in Sep 2024",
        "dir": -1
      }
    ],
    "table": {
      "header": [
        "Sep'25",
        "Sep'24",
        "Change(%)"
      ],
      "body": [
        {
          "field": "Net Sales",
          "val1": "1,877.63",
          "val2": "2,086.97",
          "chgp": "-10.03%",
          "chgp_class": "negative"
        },
        {
          "field": "Operating Profit (PBDIT) excl Other Income",
          "val1": "2.94",
          "val2": "9.62",
          "chgp": "-69.44%",
          "chgp_class": "negative"
        },
        {
          "field": "Interest",
          "val1": "0.11",
          "val2": "0.08",
          "chgp": "37.50%",
          "chgp_class": "negative"
        },
        {
          "field": "Exceptional Items",
          "val1": "0.00",
          "val2": "0.00",
          "chgp": "",
          "chgp_class": "neutral"
        },
        {
          "field": "Consolidate Net Profit",
          "val1": "2.36",
          "val2": "7.32",
          "chgp": "-67.76%",
          "chgp_class": "negative"
        },
        {
          "field": "Operating Profit Margin (Excl OI)",
          "val1": "0.16%",
          "val2": "0.46%",
          "chgp": "-0.30%",
          "chgp_class": "negative"
        }
      ]
    }
  },
  {
    "link": "nine-monthly",
    "btn_text": "All Nine Monthly Results",
    "header": "Nine Monthly Results Snapshot (Consolidated) - Dec'25",
    "rhs": [
      {
        "prefix": "Net Sales ",
        "suffix": "YoY Growth in nine months ended Dec 2025 is -0.47% vs -13.00% in Dec 2024",
        "dir": 1
      },
      {
        "prefix": "Consolidated Net Profit ",
        "suffix": "YoY Growth in nine months ended Dec 2025 is -62.30% vs -18.27% in Dec 2024",
        "dir": -1
      }
    ],
    "table": {
      "header": [
        "Dec'25",
        "Dec'24",
        "Change(%)"
      ],
      "body": [
        {
          "field": "Net Sales",
          "val1": "2,790.19",
          "val2": "2,803.37",
          "chgp": "-0.47%",
          "chgp_class": "negative"
        },
        {
          "field": "Operating Profit (PBDIT) excl Other Income",
          "val1": "3.52",
          "val2": "10.53",
          "chgp": "-66.57%",
          "chgp_class": "negative"
        },
        {
          "field": "Interest",
          "val1": "0.17",
          "val2": "0.14",
          "chgp": "21.43%",
          "chgp_class": "negative"
        },
        {
          "field": "Exceptional Items",
          "val1": "0.00",
          "val2": "0.00",
          "chgp": "",
          "chgp_class": "neutral"
        },
        {
          "field": "Consolidate Net Profit",
          "val1": "3.02",
          "val2": "8.01",
          "chgp": "-62.30%",
          "chgp_class": "negative"
        },
        {
          "field": "Operating Profit Margin (Excl OI)",
          "val1": "0.13%",
          "val2": "0.38%",
          "chgp": "-0.25%",
          "chgp_class": "negative"
        }
      ]
    }
  },
  {
    "link": "annual",
    "btn_text": "All Annual Results",
    "header": "Annual Results Snapshot (Consolidated) - Mar'26",
    "rhs": [
      {
        "prefix": "Net Sales ",
        "suffix": "YoY Growth in year ended Mar 2026 is 5.85% vs -15.27% in Mar 2025",
        "dir": 1
      },
      {
        "prefix": "Consolidated Net Profit ",
        "suffix": "YoY Growth in year ended Mar 2026 is -67.21% vs -38.54% in Mar 2025",
        "dir": -1
      }
    ],
    "table": {
      "header": [
        "Mar'26",
        "Mar'25",
        "Change(%)"
      ],
      "body": [
        {
          "field": "Net Sales",
          "val1": "3,730.96",
          "val2": "3,524.73",
          "chgp": "5.85%",
          "chgp_class": "positive"
        },
        {
          "field": "Operating Profit (PBDIT) excl Other Income",
          "val1": "3.58",
          "val2": "10.51",
          "chgp": "-65.94%",
          "chgp_class": "negative"
        },
        {
          "field": "Interest",
          "val1": "0.29",
          "val2": "0.25",
          "chgp": "16.00%",
          "chgp_class": "negative"
        },
        {
          "field": "Exceptional Items",
          "val1": "-0.79",
          "val2": "0.00",
          "chgp": "",
          "chgp_class": "neutral"
        },
        {
          "field": "Consolidate Net Profit",
          "val1": "2.63",
          "val2": "8.02",
          "chgp": "-67.21%",
          "chgp_class": "negative"
        },
        {
          "field": "Operating Profit Margin (Excl OI)",
          "val1": "0.10%",
          "val2": "0.30%",
          "chgp": "-0.20%",
          "chgp_class": "negative"
        }
      ]
    }
  }
]

Quarterly Results Snapshot (Consolidated) - Jun'26 - QoQstock-summary

Jun'26
Mar'26
Change(%)
Net Sales
1,108.30
940.77
17.81%
Operating Profit (PBDIT) excl Other Income
0.94
0.04
2,250.00%
Interest
0.06
0.11
-45.45%
Exceptional Items
0.00
-0.79
100.00%
Consolidate Net Profit
0.73
-0.39
287.18%
Operating Profit Margin (Excl OI)
0.09%
0.00%
0.09%
Values in Rs Cr.
Direction Arrows
Net Sales

QoQ Growth in quarter ended Jun 2026 is 17.81% vs 3.09% in Mar 2026

Direction Arrows
Consolidated Net Profit

QoQ Growth in quarter ended Jun 2026 is 287.18% vs -159.09% in Mar 2026

Half Yearly Results Snapshot (Consolidated) - Sep'25stock-summary

Sep'25
Sep'24
Change(%)
Net Sales
1,877.63
2,086.97
-10.03%
Operating Profit (PBDIT) excl Other Income
2.94
9.62
-69.44%
Interest
0.11
0.08
37.50%
Exceptional Items
0.00
0.00
Consolidate Net Profit
2.36
7.32
-67.76%
Operating Profit Margin (Excl OI)
0.16%
0.46%
-0.30%
Values in Rs Cr.
Direction Arrows
Net Sales

Growth in half year ended Sep 2025 is -10.03% vs -0.09% in Sep 2024

Direction Arrows
Consolidated Net Profit

Growth in half year ended Sep 2025 is -67.76% vs 31.89% in Sep 2024

Nine Monthly Results Snapshot (Consolidated) - Dec'25stock-summary

Dec'25
Dec'24
Change(%)
Net Sales
2,790.19
2,803.37
-0.47%
Operating Profit (PBDIT) excl Other Income
3.52
10.53
-66.57%
Interest
0.17
0.14
21.43%
Exceptional Items
0.00
0.00
Consolidate Net Profit
3.02
8.01
-62.30%
Operating Profit Margin (Excl OI)
0.13%
0.38%
-0.25%
Values in Rs Cr.
Direction Arrows
Net Sales

YoY Growth in nine months ended Dec 2025 is -0.47% vs -13.00% in Dec 2024

Direction Arrows
Consolidated Net Profit

YoY Growth in nine months ended Dec 2025 is -62.30% vs -18.27% in Dec 2024

Annual Results Snapshot (Consolidated) - Mar'26stock-summary

Mar'26
Mar'25
Change(%)
Net Sales
3,730.96
3,524.73
5.85%
Operating Profit (PBDIT) excl Other Income
3.58
10.51
-65.94%
Interest
0.29
0.25
16.00%
Exceptional Items
-0.79
0.00
Consolidate Net Profit
2.63
8.02
-67.21%
Operating Profit Margin (Excl OI)
0.10%
0.30%
-0.20%
Values in Rs Cr.
Direction Arrows
Net Sales

YoY Growth in year ended Mar 2026 is 5.85% vs -15.27% in Mar 2025

Direction Arrows
Consolidated Net Profit

YoY Growth in year ended Mar 2026 is -67.21% vs -38.54% in Mar 2025

stock-summaryCompany CV
About Prithvi Exchange (India) Ltd stock-summary
stock-summary
Prithvi Exchange (India) Ltd
Micro Cap
Non Banking Financial Company (NBFC)
Prithvi Exchange (India) Limited, formerly known Prithvi Softech Limited was incorporated in June, 1995. In 2016, the name of the Company was changed to Prithvi Exchange (India) Limited. The Company is licensed by RBI to function as Authorised Dealer Category - II. The Company operates under the brand "Prithvi Exchange" which convey Company's line of business i.e. Foreign Exchange. It deals in all tradable foreign currencies, traveler cheque, drafts and swift transfers.
Company Coordinates stock-summary
Company Details
No 11, East Spur Tank Road Chetpet Chennai Tamil Nadu : 600031
stock-summary
Tel: 91-044-43434250/52
stock-summary
investor.relations@prithvifx.com
Registrar Details
Integrated Enterprises (India) Ltd , II Floor , Kences Towers, No 1 Ramakrishna Street, North Usman Road, T Nagar, Chennai