
Compare R R Kabel with Similar Stocks
Dashboard
Low Debt Company with Strong Long Term Fundamental Strength
- Healthy long term growth as Net Sales has grown by an annual rate of 22.03% and Operating profit at 35.08%
- Company has a Debt to Equity ratio (avg) of 0.04 times
- The company has been able to generate a Return on Equity (avg) of 17.07% signifying high profitability per unit of shareholders funds
With a growth in Net Profit of 22.35%, the company declared Very Positive results in Jun 26
High Institutional Holdings at 22.55%
Company is among the highest 1% of companies rated by MarketsMojo across all 4,000 stocks
Stock DNA
Cables - Electricals
INR 28,944 Cr (Small Cap)
48.00
45
0.37%
0.08
19.67%
11.33
Total Returns (Price + Dividend) 
Latest dividend: 5.4902672535051495 per share ex-dividend date: Jun-16-2026
Risk Adjusted Returns v/s
Returns Beta

News
Are R R Kabel Ltd latest results good or bad?
R R Kabel Ltd's latest financial results for Q1 FY27 highlight a significant growth trajectory, showcasing robust operational performance amidst a favorable market environment. The company reported net sales of ₹3,168.20 crores, reflecting a year-on-year growth of 53.90%, which is notably higher than the average growth in the cables and electricals sector. This performance indicates strong demand across various segments, including residential and commercial construction, as well as infrastructure projects. The net profit for the quarter stood at ₹205.20 crores, marking an impressive year-on-year increase of 128.76%. This substantial growth in profitability underscores the company's effective execution of its growth strategy and operational efficiency. The operating margin, excluding other income, improved to 8.94%, which is a notable enhancement compared to the previous year, driven by better capacity util...
Read full news article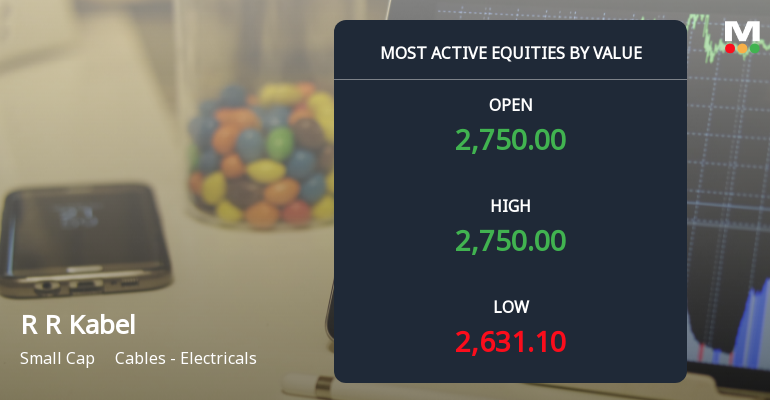
R R Kabel Ltd Surges to New High on Robust Trading Activity and Institutional Interest
R R Kabel Ltd, a prominent player in the Cables - Electricals sector, has witnessed a remarkable surge in trading activity, driven by substantial value turnover and heightened institutional participation. The stock hit a new 52-week and all-time high of Rs 2,775 on 28 Jul 2026, reflecting strong investor confidence amid robust market dynamics.
Read full news article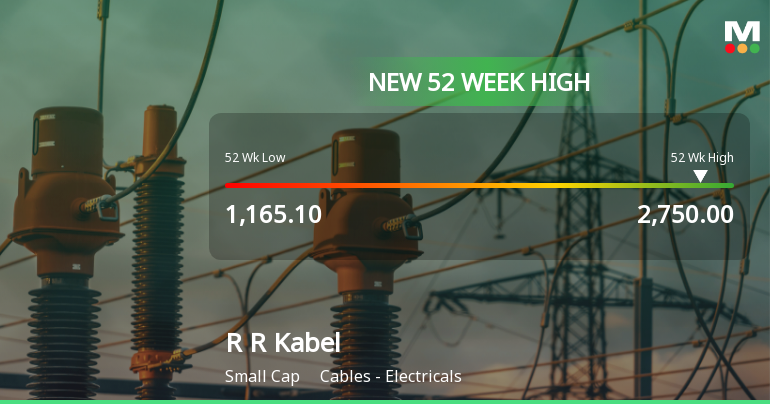
Broad-Based Technical Strength Lifts R R Kabel Ltd to 52-Week High of Rs 2750
Surging to an all-time high of Rs 2750 on 28 Jul 2026, R R Kabel Ltd has demonstrated remarkable price momentum, outperforming its sector by 7.17% today and extending a three-day winning streak that has delivered a 12.63% return. This milestone caps a year-long rally that has nearly doubled the stock price from its 52-week low of Rs 1165.1, underscoring a powerful technical alignment across multiple timeframes.
Read full news article Announcements
Announcement under Regulation 30 (LODR)-Press Release / Media Release
27-Jul-2026 | Source : BSEEnclosed herewith press release for the unaudited financial results for the quarter ended 30 June 2026.
Financial Results For The Quarter Ended 30 June 2026.
27-Jul-2026 | Source : BSEEnclosed herewith the unaudited standalone and consolidated financial results for the quarter ended 30 June 2026.
Announcement under Regulation 30 (LODR)-Investor Presentation
27-Jul-2026 | Source : BSEEnclosed herewith investor presentation for the unaudited financial results for the quarter ended 30 June 2026.
Corporate Actions

No Upcoming Board Meetings

R R Kabel Ltd has declared 110% dividend, ex-date: 16 Jun 26

No Splits history available

No Bonus history available

No Rights history available
Quality key factors
Valuation key factors
Technicals key factors
 Technical Indicator Scale: Bearish, Mildly Bearish, Sideways, Mildly Bullish, Bullish Turned
 Shareholding Snapshot : Jun 2026
Shareholding Compare (%holding)
Promoters
None
Held by 27 Schemes (11.3%)
Held by 147 FIIs (10.67%)
Tribhuvanprasad Rameshwarlal Kabra (7.37%)
Icici Prudential Flexicap Fund (4.7%)
6.94%
Quarterly Results Snapshot (Consolidated) - Jun'26 - QoQ

QoQ Growth in quarter ended Jun 2026 is 6.89% vs 16.89% in Mar 2026
QoQ Growth in quarter ended Jun 2026 is 22.22% vs 41.99% in Mar 2026
Half Yearly Results Snapshot (Consolidated) - Sep'25

Growth in half year ended Sep 2025 is 16.70% vs 12.82% in Sep 2024
Growth in half year ended Sep 2025 is 80.86% vs -23.27% in Sep 2024
Nine Monthly Results Snapshot (Consolidated) - Dec'25
YoY Growth in nine months ended Dec 2025 is 25.14% vs 11.57% in Dec 2024
YoY Growth in nine months ended Dec 2025 is 77.70% vs -16.83% in Dec 2024
Annual Results Snapshot (Consolidated) - Mar'26
YoY Growth in year ended Mar 2026 is 27.62% vs 15.52% in Mar 2025
YoY Growth in year ended Mar 2026 is 57.95% vs 4.52% in Mar 2025
About R R Kabel Ltd

Company Coordinates


