
 Price Point
Compare Raj Rayon Inds. with Similar Stocks
ScoreDashboard
Weak Long Term Fundamental Strength with an average Return on Capital Employed (ROCE) of 4.96%
- Low ability to service debt as the company has a high Debt to EBITDA ratio of 3.49 times
- OPERATING PROFIT TO INTEREST(Q) Lowest at 3.33 times
- INTEREST(9M) At Rs 14.87 cr has Grown at 36.55%
- PAT(Q) At Rs 6.86 cr has Fallen at -19.3% (vs previous 4Q average)
Despite the size of the company, domestic mutual funds hold only 0% of the company
Underperformed the market in the last 1 year
Mojo ParametersStock DNA

Garments & Apparels

INR 1,175 Cr (Micro Cap)

33.00
28

0.00%

1.12

22.23%

7.55
Total ReturnsTotal Returns (Price + Dividend) 
Latest dividend: 3.0000000000000004 per share ex-dividend date: Sep-06-2011
Risk Adjusted Returns v/s
Returns Beta
 News & Corporate Actions
News
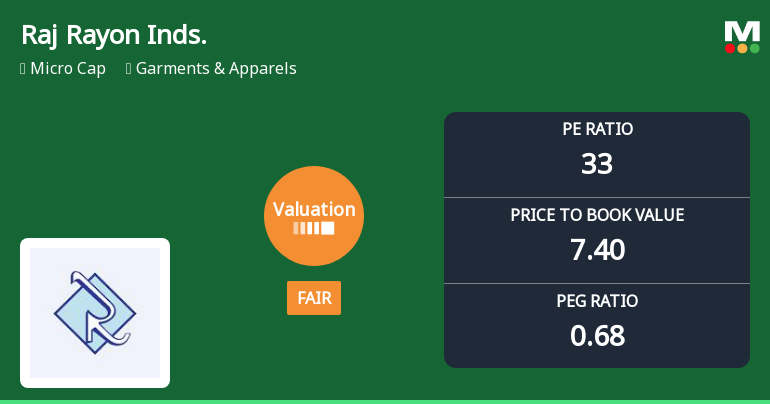
Raj Rayon Industries Ltd Valuation Shifts to Fair Amid Mixed Market Performance
Raj Rayon Industries Ltd, a micro-cap player in the Garments & Apparels sector, has seen its valuation parameters improve from expensive to fair, signalling a notable shift in price attractiveness. Despite a recent downgrade in its Mojo Grade to 'Sell' from 'Strong Sell', the company’s price-to-earnings (P/E) and price-to-book value (P/BV) ratios suggest a more balanced valuation relative to its historical levels and peer group.
Read full news article
Raj Rayon Industries Ltd is Rated Sell
Raj Rayon Industries Ltd is rated 'Sell' by MarketsMOJO, with this rating last updated on 28 August 2026. While the rating was revised on that date, the analysis and financial metrics presented here reflect the stock's current position as of 11 September 2026, providing investors with an up-to-date view of the company’s fundamentals, valuation, financial trend, and technical outlook.
Read full news article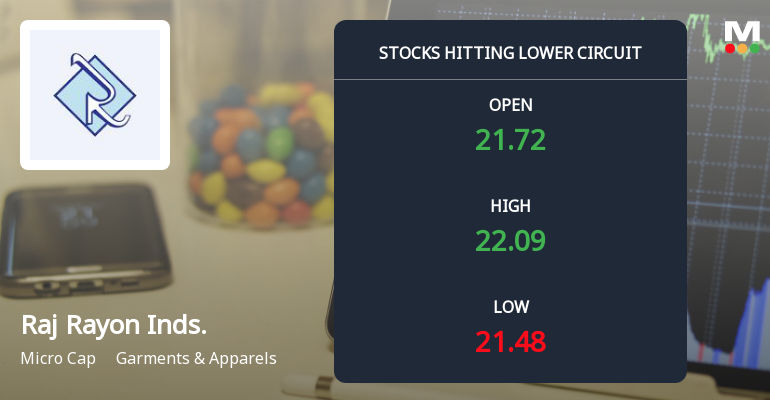
Raj Rayon Industries Ltd Locks at Lower Circuit With 1.99% Loss — Sellers Queue, No Buyers in Sight
At Rs 21.65, sellers were still queuing — but there were no buyers willing to take the other side. Raj Rayon Industries Ltd locked at its lower circuit of 1.99% on 7 Sep 2026, with unfilled sell orders and a frozen price, reflecting persistent selling pressure in a micro-cap stock with limited liquidity.
Read full news article Announcements
Announcement under Regulation 30 (LODR)-Newspaper Publication
08-Sep-2026 | Source : BSESubmission of newspaper publication of completion of dispatch of notice and annual report 2025-26 and information of AGM to be held on VCOM and evoting details
Business Responsibility and Sustainability Reporting (BRSR)
07-Sep-2026 | Source : BSESubmission of BRSR for 2025-26
Reg. 34 (1) Annual Report.
07-Sep-2026 | Source : BSEsubmission of 33rd Annual Report 2025-26
Corporate Actions

No Upcoming Board Meetings

Raj Rayon Industries Ltd has declared 3% dividend, ex-date: 06 Sep 11

Raj Rayon Industries Ltd has announced 1:10 stock split, ex-date: 04 Mar 13

No Bonus history available

No Rights history available
Key FactorsQuality key factors
Valuation key factors
Technicals key factors
 Technical Indicator Scale: Bearish, Mildly Bearish, Sideways, Mildly Bullish, Bullish Turned Shareholding
Shareholding Snapshot : Jun 2026
Shareholding Compare (%holding)
Promoters
None
Held by 0 Schemes
Held by 0 FIIs
Svg Fashions Private Limited (84.88%)
Ankit Ganeriwal (1.23%)
5.62%
FinancialQuarterly Results Snapshot (Standalone) - Jun'26 - QoQ
 Compare with Peers
QoQ Growth in quarter ended Jun 2026 is -30.65% vs -3.46% in Mar 2026
QoQ Growth in quarter ended Jun 2026 is -51.10% vs 139.01% in Mar 2026

Half Yearly Results Snapshot (Standalone) - Sep'25

Growth in half year ended Sep 2025 is 39.91% vs 24.49% in Sep 2024
Growth in half year ended Sep 2025 is 280.87% vs -288.62% in Sep 2024
Nine Monthly Results Snapshot (Standalone) - Dec'25
YoY Growth in nine months ended Dec 2025 is 37.51% vs 21.86% in Dec 2024
YoY Growth in nine months ended Dec 2025 is 5,444.44% vs -94.17% in Dec 2024
Annual Results Snapshot (Standalone) - Mar'26
YoY Growth in year ended Mar 2026 is 38.89% vs 13.98% in Mar 2025
YoY Growth in year ended Mar 2026 is 146.13% vs 241.83% in Mar 2025
 Company CV
About Raj Rayon Industries Ltd

Company Coordinates










